Download

1 / 12
120 likes | 245 Vues
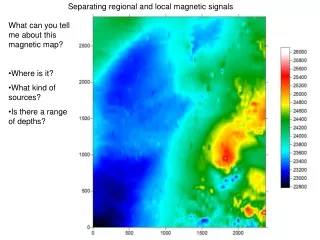
Separating regional and local magnetic signals. What can you tell me about this magnetic map? Where is it? What kind of sources? Is there a range of depths?. What do you see on the contours that you missed on the image map?. Anything new on the surface map?.

E N D
Separating regional and local magnetic signals • What can you tell me about this magnetic map? • Where is it? • What kind of sources? • Is there a range of depths?
What do you see on the contours that you missed on the image map?
Upward Continuation Provides Separation & Qualitative Depth Estimation The rules of thumb from Jacobsen (1987): To extract (isolate) a regional field at a depth of z0, upward continue the observed field to 2*z0. In the wavenumber domain, the optimal filter for that extraction is: Breg(k) = exp(-2 k z0) You can then subtract this regional field from the total field to isolate the residual field. To find the magnetization from an equivalent source between depths z1 and z2, subtract the upward continuation to 2*z2 from that of 2*z1. That is, simply find the difference between the upward continuations to twice the values of the respective depths. In the wavenumber domain, the optimal filter for that extraction is: Bslab(k) = exp(-2 k z1) – exp(-2 k z2) Anomalies originating inside the equivalent source layer typically stand out much more prominently after the filtering. Jacobsen, 1987, A case for upward continuation as a standard separation filter for potential- field maps, Geophysics, v. 52. #8, p. 1138 – 1148.
Total Magnetic Intensity TMI upward continued 1,000 metersnote the range of the upward continued field (23,980 – 23640 = 340 nt). Most sources appear to be ‘shallow’.
TMI TMI upward continued 250 meters
TMI upward continued 50 meters upward continued 250 metersDifferencing these two yields the magnetization from an equivalent source at depths between 25 and 125 meters.
The magnetization from an equivalent source at depths between 25 and 125 meters determined by subtracting the upward continuation to 50 meters from the upward continuation to 250 meters.