Behavioral Risk Factor Surveillance System
BRFSS. 2003 Northeast NC II Region* NC BRFSS Survey Results. Behavioral Risk Factor Surveillance System. State Center for Health Statistics Division of Public Health North Carolina Department of Health and Human Services. History of the BRFSS Survey.

Behavioral Risk Factor Surveillance System
E N D
Presentation Transcript
BRFSS 2003 NortheastNC II Region* NC BRFSS Survey Results Behavioral Risk Factor Surveillance System State Center for Health Statistics Division of Public Health North Carolina Department of Health and Human Services
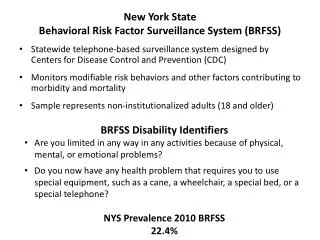
History of the BRFSS Survey • Developed by the Centers for Disease Control and Prevention (CDC) and state health departments in the early 1980s in response to the need for: • on-going assessment of adult health-risk behaviors and health practices; • provision of state and regional (and now county) estimates for targeting high-risk groups. • It is the largest and longest running telephone health survey in the world.
BRFSS in the U.S., 1994 Guam Puerto Rico Virgin Islands
The 2003 North Carolina BRFSS • For the 2003 survey, the North Carolina BRFSS Program conducted interviews in both English and Spanish and interviewed a total of 9,455 adults. • The 2003 sample design included over-sampling of five counties and 12 regions consisting of more than 50 smaller counties to produce county or regional BRFSS estimates. In addition, estimates were produced for three, broad regions of the state: Western, Piedmont, and Eastern. • The 2003 results for each question are available on the BRFSS web site by sex, race, Hispanic origin and language (English, Spanish-only), age group, education level, household income, and county and region. The 2003 data provide estimates on the health of Native Americans and Spanish-speaking only Hispanics, see:www.schs.state.nc.us/SCHS/healthstats/brfss /2003/highlights.html
Weighting the BRFSS Data • BRFSS data are directly weighted for the probability of selection of a telephone number, the number of adults (18+ yrs.) in a household, and the number of phones in a household. • Additional weights are developed for non-coverage, i.e. households with no telephones, and for differences between the sample characteristics and the state population characteristics. • A final weight is assigned to each respondent so that the weighted proportion and weighted number of respondents by sex, age, and race matches the state population. Note: all results are based on weighted data
Standard BRFSSData Collection Methods • Ongoing monthly telephone interviews using random digit dialing • Computer-assisted telephone interviewing (CATI) • Probability sampling of noninstitutionalized adults (18+ years) in households with telephones
The BRFSS Questionnaire • Standard Core Questions Required by CDC and asked every year by all participants. • Rotating Core Questions Required by CDC and asked every other year by all participants. • Emerging Core Questions Required by CDC and asked every one time by all participants. • Optional Modules offered and supported by CDC Included if sponsored by state programs/agencies. • State-Added Questions Developed and sponsored by state programs/agencies.
Core Sections Health status Health care access Diabetes Hypertension Cholesterol Weight control Asthma Immunization Tobacco/alcohol Arthritis/disability Demographics Physical Activity Veteran’s status HIV/AIDs Optional Modules Diabetes Influenza Heart Attack & Stroke Cardiovascular disease Tobacco indicators Other tobacco products Binge drinking Survey Topics on the NC 2003 BRFSS State-added • Arthritis • Disability & aging • Tobacco tax • Diabetes screening • Weight loss products • Violence
About this 2003 BRFSS Slide Presentation • Objectives: (1) promote BRFSS data use and dissemination by North Carolina public health professionals; and (2) by mixing or selecting specific slides, presentations may be tailored or modified to suit the needs of the county/presenter. • Talking points: slides include talking points to help with interpretation of the results. • Survey questions: the BRFSS survey questions are quoted verbatim in the talking points. • Nationwide data: for core topics, nationwide estimates (means) are provided for comparison. • Calculations: only weighted data are presented and all “unknowns/refusals” are excluded from calculations.
About this 2002 BRFSS Presentation (cont.) • Cautionary Notes: • These results need to be viewed as estimates and not the actual or true value of the outcome of interest. • With any estimate based on a random sample, there is a margin of error. For the 16 oversampled counties and regions the margin of error is about 5% if the question was asked of all respondents. This means that we can expect the true value to lie somewhere between the sample estimate plus or minus 5 percent. • When county results are subset by age or race, for example, the margin of error increases as a function of the resulting smaller sample size. • Use caution when comparing the results across counties, as the margin of error may not be the same for all counties.
Geographical Analysis Used in this Presentation In this presentation, we show the results for the featured county or region of interest with those of North Carolina, the state’s urban and rural counties, three regions of the state including the Western, Eastern and Piedmont regions, and the results for the United States, when BRFSS questions appear in Core Section or in standard Modules. Urban and rural counties are defined as follows: • Urban counties include Buncombe, Cumberland, Davidson, Durham, Forsyth, Gaston, Guilford, Mecklenburg, Onslow and Wake. • All other counties are classified as rural.
Geographical Analysis (cont.) The three regions are defined accordingly: The Western region includes Alleghany, Ashe, Avery, Buncombe, Burke, Caldwell, Cherokee, Clay, Graham, Haywood, Henderson, Jackson, McDowell, Macon, Madison, Mitchell, Polk, Rutherford, Surry, Swain, Transylvania, Watauga, Wilkes, and Yancey counties. The Eastern region includes Beaufort, Bertie, Bladen, Brunswick, Camden, Carteret, Chowan, Columbus, Craven, Cumberland, Currituck, Dare, Duplin, Edgecombe, Gates, Greene, Halifax, Harnett, Hertford, Hoke, Hyde, Johnston, Jones, Lenoir, Martin, Nash, New Hanover, Northampton, Onslow, Pamlico, Pasquotank, Pender, Perquimans, Pitt, Robeson, Sampson, Scotland, Tyrrell, Washington, Wayne, and Wilson counties. The Piedmont region includes Alamance, Alexander, Anson, Cabarrus, Caswell, Catawba, Chatham, Cleveland, Davidson, Davie, Durham, Forsyth, Franklin, Gaston, Granville, Guilford, Iredell, Lee, Lincoln, Mecklenburg, Montgomery, Moore, Northeast NC II, Person, Randolph, Richmond, Rockingham, Rowan, Stanly, Stokes, Union, Vance, Wake, Warren, and Yadkin counties.
i.Sample Size & Demographics Health Status/Healthy Days Health Care Access Chronic Diseases Disability Care for Aging Immunization Physical Activity Tobacco Use Tobacco Prevention Rules About Smoking Other Tobacco Products Tobacco Tax Risk Factors HIV/AIDS Obesity Weight Control Weight Loss Products Knowledge of Signs & Symptoms of Heart Attack & Stroke Cardiovascular Disease Excess Sun Exposure Binge Drinking Falls Physical Assault 2003 BRFSS Tracked HP2010 Objectives Contents of Presentation
2003 NC BRFSS Sample Demographic Characteristics *weighted percentages
2002 NC BRFSS Sample Demographic Characteristics (cont.) *weighted percentages
I. Health Status/Healthy Days Perceived Fair/Poor Health Poor Physical Health Days Poor Mental Health Days Restricted Activity Days I.Health Status/Healthy Days
Perceived Fair or Poor Health I. Health Status/Healthy Days
Fair or Poor Health by Sex, Race, Age, Education & Income: Northeast NC II & NC % I. Health Status/Healthy Days
Poor Physical Health Days (8+ days out of past 30 days) I. Health Status/Healthy Days
Poor Mental Health Days (8+ days out of past 30 days) I. Health Status/Healthy Days
Restricted Activity Days (8+ days past 30 days)* I. Health Status/Healthy Days
II. Health Care Access No Health Insurance Coverage No Personal Doctor Cost Prevented Access II. Health Care Access
No Health Insurance Coverage (ages 18 to 64) II. Health Care Access
No Health Insurance Coverage by Sex, Race, Age (18-64 yrs.), Education & Income: Northeast NC II & NC % II. Health Care Access
No Health Insurance Coverage (all ages) II. Health Care Access
Does Not Have a Personal Doctor* II. Health Care Access
Time When Needed To See Doctor But Could Not Because of Cost II. Health Care Access
III. Chronic Diseases • Arthritis • Asthma • Diabetes • High Blood Pressure • High Cholesterol III. Chronic Diseases
Arthritis III. Chronic Diseases
Ever Told by a Doctor You Have Some Form of Arthritis III. Chronic Diseases
The Prevalence of Arthritis by Sex, Race, Age, Education & Income: Northeast NC II & NC % III. Chronic Diseases
Joint Pain in Past 30 Days III. Chronic Diseases
Joint Symptoms Began More than Three Months Ago* III. Chronic Diseases
Ever Seen a Health Professional for Joint Symptoms* III. Chronic Diseases
Now Limited Because of Joint Symptoms or Arthritis III. Chronic Diseases
Joint Symptoms or Arthritis Now Affects Work-related Activities III. Chronic Diseases
Doctor Suggested Losing Weight to Help with Arthritis or Joint Symptoms III. Chronic Diseases
Doctor Suggested Physical Activity to Help with Arthritis or Joint Symptoms III. Chronic Diseases
Asthma III. Chronic Diseases
Ever Diagnosed with Asthma III. Chronic Diseases
Ever Diagnosed with Asthma by Sex, Race, Age, Education & Income: Northeast NC II & NC % III. Chronic Diseases
Currently has Asthma III. Chronic Diseases
Diabetes III. Chronic Diseases
Diabetes Prevalence III. Chronic Diseases
The Prevalence of Diabetes by Sex, Race, Age, Education & Income: Northeast NC II & NC % III. Chronic Diseases
Ever Had a Blood Test for Diabetes III. Chronic Diseases