Overweight/Obesity & Physical Inactivity
410 likes | 630 Vues
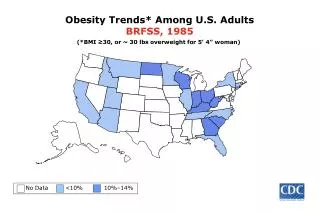
Overweight/Obesity & Physical Inactivity. Healthy Kansans 2010 Steering Committee Meeting April 22, 2005. 1991. Obesity Trends* Among U.S. Adults BRFSS, 1991, 1996, 2003. (*BMI 30, or about 30 lbs overweight for 5’4” person). 1996. 2003.

Overweight/Obesity & Physical Inactivity
E N D
Presentation Transcript
Overweight/Obesity & Physical Inactivity Healthy Kansans 2010 Steering Committee Meeting April 22, 2005
1991 Obesity Trends* Among U.S. AdultsBRFSS,1991, 1996, 2003 (*BMI 30, or about 30 lbs overweight for 5’4” person) 1996 2003 No Data <10% 10%–14% 15%–19% 20%–24% ≥25%
Kansas Childhood Overweight and Obesity Statistics • In 1999-2000, 15% of 6-19 year old children & teens were overweight. • Over 10% of pre-school-aged children (ages 2 - 5) are overweight (up from 7% in 1994). • Another 15% of children and teens are considered at risk for becoming overweight • Childhood obesity has increased 36% in the past 20 years Source: Kansas Department of Health & Environment Office of Health Promotion
Youth Obesity in Kansas Source: 2002-2003 Kansas Youth Tobacco Survey Kansas Department of Health & Environment
Overweight Prevalence by Race/Ethnicity for Adolescent Boys Aged 12 - 19 Years Percentage Source: JAMA, Oct. 9, 2002, Vol. 288, No. 14:1731
Impact of Childhood Overweight (BMI > 95th percentile) on Adult Obesity (BMI > 30) • 25% obese adults were overweight children • Onset of overweight < 8y predicts more severe obesity in adulthood (BMI = 41.7 vs 34.0) • CVD risk factors reflect adult BMI Freedman et al, Pediatrics 2001; 108: 712
NHES 1960-1962 NHANES I 1971-1975 NHANES II 1976-1980 NHANES III 1988-1994 NHANES III 1999-2000 <25 52.1% 53.4% 54.0% 45.4% 36.3% 33.3% 32.3% 25-29 31.5% 32.1% 33.3% >=30 14.6% 14.3% 14.5% 22.5% 30.4% Measured BMI Categories of NHANES Respondents 1960-2000 Abbreviations: NHANES, National Health and Nutrition Examination Survey; NHES, National Health Examination Survey *Estimates are weighted to be representative of the US noninstitutionalized population aged 20 to 74 years. **Body mass index (BMI) was calculated as weight in kilograms divided by the square of height in meters. JAMA, April 20, 2005 – Vol 293, No.15
BRFSS Trends Data: KansasAdult Percent Overweight By BMIBMI 25-29.9 Source: Kansas Department of Health & Environment Behavioral Risk Factor Surveillance System
BRFSS Trends Data: KansasAdult Percent Obese: By BMIBMI > 30 Kansas Department of Health & Environment Behavioral Risk Factor Surveillance System
Percentage of Kansas Adults Who Are Obese by Ethnicity and Race Kansas Department of Health & Environment Behavioral Risk Factor Surveillance System, 2004
Healthy People 2010 Objectives • 19-3c: Reduce the proportion of children and adolescents who are overweight or obese. • 19-2: Reduce the proportion of adults who are obese.
Why Objectives to Reduce Overweight & Obesity Make Sense Age- and Sex-Adjusted Prevalence of US Adults Aged 20 to 74 Years Reporting Cholesterol and Blood Pressure Medication Use Medication Use by BMI Group Cholesterol: NHES 1960-1962 NHANES I 1971-1975 NHANES II 1976-1980 NHANES III 1988-1994 NHANES III 1999-2000 Total Change(95% ConfidenceInterval <25 1.8% (0.4-3.2) 2.2 5 4.0% 25-29.9 5.8% (3.6-8.0) 3.3% 9.1% >=30 5.7% (3.9-7.5) 3.5% 9.2% Overall 3.0% 7.4% 4.4% (3.2-5.6) Blood Pressure 6.8% 5.9% 8.2% 3.5% (1.1-5.9) <25 4.7% 5.6% 11.8% 11.8% 16.7% 10.7% (7.9-13.5) 25-29.9 6.0% 8.6% >=30 18.9% 19.9% 27.6% 16.2% (12.1-20.2) 11.4% 14.2% Overall 6.7% 11.3% 11.2% 15.5% 8.8% (6.6-11.0) 8.7% Abbreviations: NHANES, National Health and Nutrition Examination Survey; NHES, National Health Examination Survey. *All prevalence estimates are age- and sex-adjusted percentages. Denominators vary for cholesterol medication use (n=17918) and blood pressure medication use (n=49794). ** Body mass index (BMI) was calculated as weight in kilograms divided by the square of height in meters. Source: JAMA, April 20, 2005- Volume 293, no. 15
Why Objectives to Reduce Overweight & Obesity Make Sense Abbreviations: NHANES, National Health and Nutrition Examination Survey; NHES, National Health Examination Survey. ** Body mass index (BMI) was calculated as weight in kilograms divided by the square of height in meters. Source: JAMA, April 20, 2005- Volume 293, no. 15
2003 Obesity for All Ages Compared to HP2010 Targets Source: Centers for Disease Control and Prevention, National Center for Health Statistics. National Health and Nutrition Examination Survey. 1988-1994.
Why is Obesity/Overweight a Growing Problem? • Built Environment • Policy • Bias & Discrimination • Individual Attitudes,Knowledge & Skills
Who is at Highest Risk? • Children & Adolescents • Low Income Women • African American Women • Mexican and African American Men
U.S. Physical Activity Statistics: 1986–2002 No Leisure-Time Physical Activity Trend Chart U.S. Physical Activity Statistics: 1986–2002 No Leisure-Time Physical Activity Trend Chart Content source: Division of Nutrition and Physical Activity, National Center for Chronic Disease Prevention and Health Promotion
BRFSS Trends Data: KansasAdults With No Leisure Time Physical Activity Source: Centers for Disease Control and Prevention, National Center for Chronic Disease Prevention and Health Promotion. Behavioral Risk Factor Surveillance System Trends Data: Kansas
Percentage of U.S. High School Students Who Did Not Attend Physical Education Classes Daily YRBS National Surveys, 1991–2001 Centers for Disease Control & Prevention
Healthy People 2010 Goals • 22-7: Increase the proportion of adolescents who engage in vigorous physical activity that promotes cardiorespiratory fitness 3 or more days per week for 20 or more minutes per occasion. • 22-2: Increase the proportion of adults who engage regularly, preferably daily, in moderate physical activity for at least 30 minutes per day.
Why is Increase Physical Activity for Children & Youth? • Study of school-age youth in 34 countries: • Significant (P<0.05) negative relationship between physical activity patterns and BMI classification in 29 of 33 countries (88%) • Significant (P<0.05) positive relationship between television viewing time and BMI classification in 22 of 34 countries (65%) 2005 The International Association for the Study of Obesity Obesity Reviews 6, 123-132
Why Increase Physical Activity for Children & Youth? • Study of school-age youth in 34 countries: • Likelihood of being overweight was significantly lower in dose-response manner with higher physical activity participation in 29 or 33 countries (88%) 2005 The International Association for the Study of Obesity Obesity Reviews 6, 123-132
Why Increase Physical Activity for Adults? Source: Hu, FB, Willett, WC, Meir, TL, et al New England Journal of Medicine, Dec. 23, 2004, Vol. 351, 26
Participation in regular physical activity, United States, 1990–99 *
Why is Physical inactivity a Growing Problem? • Built Environment • Policies • Time Constraints
Who is at Greatest Risk? • Women • Low income/low education • African Americans & Hispanics • People with disabilities • Elderly
Recommendations for Addressing Physical Inactivity in Kansas Now? • The Community Guide to Preventive Services recommends community-wide campaigns using multiple media outlets to promote physical activity, conducted in collaboration with strategies of: • Social support networks, • Individual behavior change through knowledge & skill development, & • Environmental & policy change
Recommendations for Addressing Physical Inactivity in Kansas Now? • The Community Guide to Preventive Services recommends enhanced Physical Education Classes in schools to increase physical activity among youth, including: • Mandatory daily Physical Education • Making PE classes longer in length • Increasing duration & intensity of students’ activity during PE classes
Recommendations for Addressing Physical Inactivity in Kansas Now? • The Community Guide to Preventive Services recommends creating or improving access to places for physical activity, including: • Creating walking trails • Building exercise facilities • Providing increased access to existing facilities
Current Statewide Efforts to Address Obesity and Physical Inactivity in Kansas • Kansas LEAN • Coordinated School Health Initiative • Healthy Congregations in Action • Health foundations’ initiatives to evaluate obesity &/or nutrition/physical activity KANSAS
What Are Kansas’ Assets for Improving These Health Issues? • Collaborative partnerships: Kansas LEAN, Kansas Nutrition Network, Wichita Wellness Coalition, etc. • Academic Expertise & Resources: University of Kansas School of Medicine, University of Kansas, Kansas State University Community Health Institute, etc.
What Are Kansas’ Assets for Improving These Health Issues? • Health Foundations in Kansas • State Health and Education Departments working in partnership • Business coalitions focused on health
What Are Barriers or Liabilities That Are Limiting Progress in Kansas? • Lack of YRBS or comparable youth data • Lack of consistently reported data for ease of comparison • Lack of health & physical education policy in schools • Lack of skills among primary care practitioners in preventing &/or managing obesity
Chronic Care Model Environment Medical System Patient Self-Management Family School Worksite Community Information Systems Decision Support Delivery System Design Self Management Support
What Are Barriers or Liabilities That Are Limiting Progress in Kansas? • Lack of third party reimbursement for lifestyle management (prevention) • Lack of third party reimbursement for weight loss management • Health care system that limits time for prevention activities by practitioners
Recommendations • Coordinated awareness & skills development campaigns to increase understanding of metabolic syndrome & to develop the skills individuals need to modify their environments and their behaviors, including: • Increasing physical activity • Decreasing television viewing time
Recommendations • Policy changes to require > 30 minutes daily Physical Education in schools at all levels • Policy changes to limit competitive foods in schools, provide universal school meals & close campuses at mealtimes in all schools
Recommendations • Incentive programs to encourage communities, work sites & schools to increase access to physical activity venues • Incentive programs to encourage communities, work sites & schools to create and/or improve venues that encourage and support leisure time & transportation physical activity
Recommendations • Medical school curriculum modifications to include skills in motivational interviewing & standardized patients with metabolic syndrome
James Early, M.D.Clinical Associate Professorjearly@kumc.eduJudy Johnston, M.S., R.D., L.D.Research Instructorjjohnsto@kumc.eduDepartment of Preventive Medicine & Public HealthUniversity of Kansas School of Medicine – Wichita316-293-2627