Introduction to ocean observatories
Introduction to ocean observatories. EBS566: Estuary and Ocean Systems II – Lecture 1, Winter 2010 Instructors: T. Peterson, M. Haygood, A. Baptista Division of Environmental and Biomolecular Systems, Oregon Health & Science University. Logistics.

Introduction to ocean observatories
E N D
Presentation Transcript
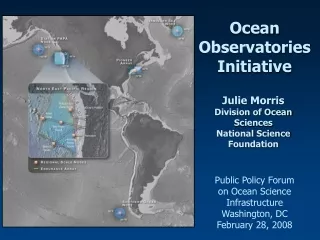
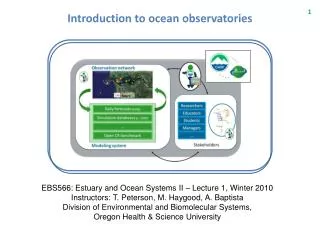
Introduction to ocean observatories EBS566: Estuary and Ocean Systems II – Lecture 1, Winter 2010 Instructors: T. Peterson, M. Haygood, A. Baptista Division of Environmental and Biomolecular Systems, Oregon Health & Science University
Logistics Grade for Part I of EBS566 will be based on a 24h take-home exam (15% of the total grade for the course) , a team assignment (15%) and class participation (one third of 10%). • The statement for the 24h exam will be made available at the end of class 8 (or alternative date, to be arranged in class) • The team assignment will require the construction (and demonstration in class 8) of a web page with scientific content (see scope in slides 5 and 6). • There will be a 30min discussion of a reading assignment in classes 2, 4 and 7. Assuming nine students in the class, four students will ask questions (one twice) and five will answer them. Asking questions will be student numbers 1-4 (class 2), 5-8 (class 4) and 9,2,4,6 (class 6) • Teams and student numbers are pre-assigned (slide 4)
Logistics Reading assignments • Class 2 Hickey, B. M., R. M. Kudela, J. D. Nash, K. W. Bruland, W. T. Peterson, P. MacCready, E. J. Lessard, D. A. Jay, N. S. Banas, A. M. Baptista, E. P. Dever, P. M. Kosro, L. K. Kilcher, A. R. Horner-Devine, E. D. Zaron, R. M. McCabe, J. Peterson, P. M. Orton, J. Pan, and M. C. Lohan (2010), River influences on shelf ecosystems: Introduction and synthesis, J. Geophys. Res., doi:10.1029/2009JC005452, in press. • Class 4 Chawla, A., D.A. Jay, A.M. Baptista, M. Wilkin, C. Seaton (2008). Seasonal variability and estuary-shelf interactions in circulation dynamics of a river- dominated estuary. Estuaries and Coasts 31(2): 269-288. • Class 6 Nash, J.D and J.N. Moum (2005). River plumes as a source of large-amplitude internalwaves in the coastal ocean. Nature Vol 437|15 September 2005|doi:10.1038/nature03936
Team assignment (1/2) Goal: Place one biological or geochemical SATURN variable in physical context Each team will be assigned one of the following three instruments, all of which are deployed at SATURN-03: • CDOM fluorometer (Webstar) • SUNA or ISUS (optical nitrate, Satlantic) • Phytoflash (Turner) In Class 8, each team will demonstrate a web-based report covering a three-part scope. The report should be user-friendly, built in the CMOP Drupal server, and should not rely on file attachments. Although time management is your choice, it is recommended that you complete one part per week. Part 1: Get familiar with the instrument Write a single-space ~two-page description of the instrument. Include: (a) measured variable(s) and its (their) significance in estuaries; (b) measuring principle; (c) operational considerations for deployment in estuaries; (d) quality control procedures; (e) picture of instrument; (f) schematic of installation at SATURN-03; (d) a time series of uninterrupted data of usable quality, for a spring-neap cycle of your choice.
Team assignment (2/2) Part 2: Temporal variability in forcing context Describe the variability of the signal of your instrument at a chosen level as a function of relevant forcing (a) during a spring-neap tidal cycle; and (b) before, during and after an estuarine turbidity maxima event. Each description should be done in two single-space pages, with one figure. For context, also use in your analysis salinity and a third (non-forcing) variable of your choice. Part 3: Spatial gradients Characterize a spatial gradient (vertical or horizontal) of your choice for your primary variable. Explain as a function of forcing, and of equivalent gradient of salinity and of a third variable of your choice.
Course overview (Lectures 1-7) Lecture (day) • Introduction to ocean observatories • National context 1 (1/04) • The SATURN collaboratory 1, 2 (1/06) • Descriptive estuarine and plume circulation 3 (1/11), 4 (1/13) • MLK holiday (no class) 5 (1/18) • Introduction to circulation modeling 6 (1/20), 7 (1/25) • Exam 8 (1/27)
Ocean observatories - Fundamental Issue We are limited and poorly coordinated with respect to environmental data supporting fundamental societal needs R. Spinrad, NOAA
The vision for IOOS • An operational, integrated, and sustained ocean observing system (IOOS), envisioned to routinely, reliably, and continuously provide data and information required to address seven societal goals: • Detect and forecast oceanic components of climate variability • Facilitate safe and efficient marine operations • Ensure national security • Manage resources for sustainable use • Preserve and restoring healthy marine ecosystems • Mitigate natural hazards • Ensure public health 1 System, 7 Goals (click on logo, for link used in class)
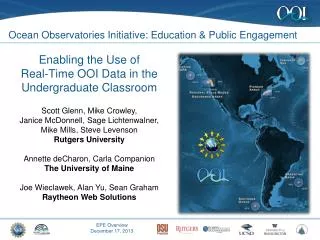
NANOOS observation network (click on logo, for link used in class) From Martin et al. 2007
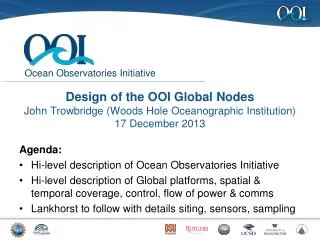
NSF Ocean Observatories Initiative All figures from JOI 2007 Components: Global ● Regional ● Coastal pioneer array ● Coastal endurance array
Coastal endurance array All figures from JOI 2007 Map of the location of the endurance array, off of the Oregon Endurance array sites (at 25 m, 80 m, and 500 m) complement first node of RSN Sites have surface element and full water column profiling capability
Regional scale nodes All figures from JOI 2007
SATURN Goal: To explore and advance (a) what constitutes, (b) how to build, sustain and evolve, and (c) how to create the conditions for the effective use of collaboratories, using the Columbia River as testbed. What is a collaboratory? Modeling system Endurance stations Pioneer array Cyberinfrastructure
Working definition A coastal margin collaboratory is … … a networked integration of sensors, platforms, models, data, analyses and collaboration & social processes, … that enables diverse stakeholders to interact without geographic, disciplinary or institutional barriers, … towards the understanding, operation and sustainability of coastal margins “a collaboratory is […] a new networked organizational form that also includes social processes; collaboration techniques; formal and informal communication; and agreement on norms, principles, values, and rules” (Derrick Cogburn, 2003).
The Columbia River multi-scale setting Freshwater input Ocean circulation Climate systems Bottom salinity (psu) The estuary and plume as integrators
The Columbia River multi-scale setting Q (m3/s) Columbia River • Climate forcing • Pacific Decadal Oscillation & ENSO (precipitation, ocean climate) • Global climate change • (sea level rise, snow pack, …) Winter 01 courtesy J. Barth N W E Barnes et al. 1972 S N E W E S Summer 01
Time scales of interest Credit: Murray Levine
19 Events and gradient regions SATURN Assets Seismic event simulations demonstrate impact on benthic topology and alterations to ecosystem habitats Microbial analysis demonstrates that prokaryotic gene expression patterns are characterized by large seasonal differences and protist assemblages have a seasonal succession cycle (April- Katablepharis, Aug.-Sept.- M. rubra) CORIE Station SATURN Station (SAT) AUV Subduction zone Winter Plume Baker Bay Glider Bays are a habitat of the Cryptomonad prey (Teleaulax) for M.rubra bloom DOC, DON CH4, NH4+, Mn+ Pacific Ocean DOC, DON 18S rDNA and taxonomic examination indicate that diatoms contribute significantly to ETM biomass ETM is area of heightened microbial activity. CH4, NH4+, Mn+ Diatoms (marine) ETM TSS, POM Metal Oxides SAT1 Shipping channel M. rubra SAT2 Diatoms (freshwater) POM, Nutrients ETM DOM, POM, and nutrient exchange Summer Plume SAT4 SAT3 Salinity intrusion Anthropogenic activities influence river flow through hydropower, dredging, and agriculture ETM Upwelling supplies nutrient rich and oxygen deficient marine water Plume Front SAT5 Cathlamet Bay Young’s Bay In situ sensors measure biogeochemical exchanges between sediments and water column. Intertidal zones/mudflat interactions include accretion on flood , erosion on ebb and exchange of DOC, DON, CH4, NH4+, Mn+ Activity, rate and biomass measurements demonstrate that plume and estuary are areas of high microbial activity and nutrient cycling Climate change forecasts indicate increases in upwelling and a larger river plume that may affect productivity and hypoxia Climate change forecasts demonstrate an increase in salinity intrusion, altering biogeochemical cycles and organism life histories (e.g. timing and intensity of M. rubra bloom)
Maintaining the SATURN observation network Color sequences are taken from a surface camera. Black and white sequences are from a camera installed on the headgear of the diver. Credits: Jeff Schilling (video), Michael Wilkin and Jon Graves (divers). See also: http://www.youtube.com/coastalmargins
21 Grand Coulee Dam Well, the world has seven wonders that the trav'lers always tell,Some gardens and some towers, I guess you know them well,But now the greatest wonder is in Uncle Sam's fair land,It's the King Columbia River and the big Grand Coulee Dam. She heads up the Canadian Rockies where the rippling waters glide,Comes a-roaring down the canyon to meet the salty tide,Of the wide Pacific Ocean where the sun sets in the WestAnd the big Grand Coulee country in the land I love the best. In the misty crystal glitter of that wild and wind ward spray,Men have fought the pounding waters and met a watery grave,Well, she tore their boats to splinters but she gave men dreams to dreamOf the day the Coulee Dam would cross that wild and wasted stream. Uncle Sam took up the challenge in the year of 'thiry-three,For the farmer and the factory and all of you and me,He said, "Roll along, Columbia, you can ramble to the sea,But river, while you're rambling, you can do some work for me.“ Now in Washington and Oregon you can hear the factories hum,Making chrome and making manganese and light aluminum,And there roars the flying fortress now to fight for Uncle Sam,Spawned upon the King Columbia by the big Grand Coulee Dam. Lyrics from http://www.woodyguthrie.org/Lyrics/Lyrics.htm