Download
1 / 109
1.09k likes | 1.11k Vues
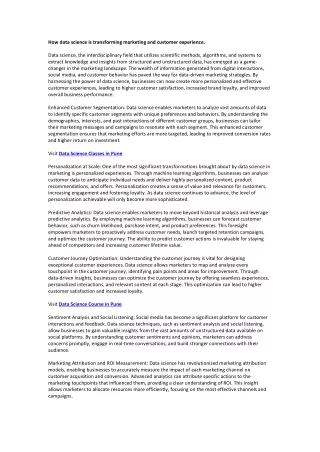
https://www.google.com/maps/place/ExcelR Solutions - Data Science Training Course | Digital Marketing Course in Pune/@18.5584617,73.7889225,17z/data=!3m1!4b1!4m5!3m4!1s0x3bc2bf37817aae43:0x6c49e2eda8b01c77!8m2!3d18.5584566!4d73.7911112<br>Data science Course in Pune has been the in demand and Excelr is serving with experienced faculty in industry, with placement assistance and 24x7 support.

E N D
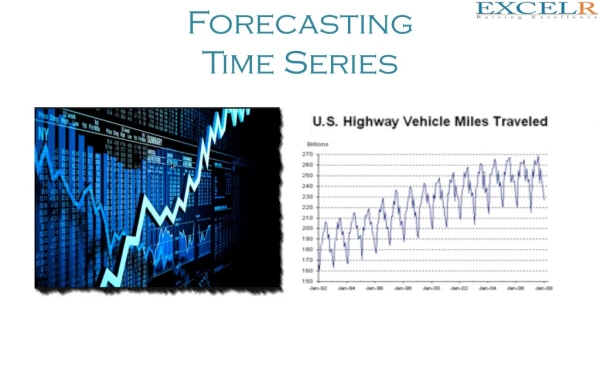
Forecasting Time Series
My Introduction Name:BharaniKumar Educa+on:IITHyderabad IndianSchoolofBusiness Professionalcer+fica+ons: PMP PMI-ACP PMI-RMP CSM LSSGB LSSBB SSMBB ITIL AgilePM ProjectManagementProfessional AgileCer4fiedPrac44oner RiskManagementProfessional Cer4fiedScrumMaster LeanSixSigmaGreenBelt LeanSixSigmaBlackBelt SixSigmaMasterBlackBelt Informa4onTechnologyInfrastructureLibrary DynamicSystemDevelopmentMethodologyAtern © 2013 ExcelR Solutions. All Rights Reserved
My Introduction 4 RESEARCHin ANALYTICS,DEEP LEARNING&IOT DATASCIENTIST 3 2 DeloiHe DrivenusingUSpolicies 1 Infosys DrivenusingIndianpoliciesunderLargeenterprises ITCInfotech DrivenusingIndianpoliciesSME HSBC DrivenusingUKpolicies © 2013 ExcelR Solutions. All Rights Reserved
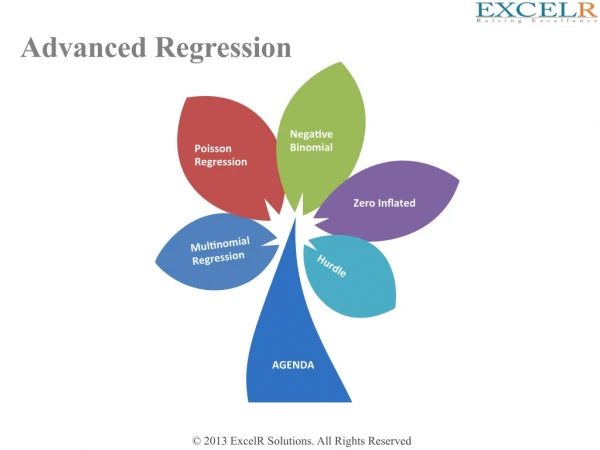
AGENDA WhyForecas4ng Learnaboutthevariousexamplesof forecasHng Forecas4ngStrategy Learnaboutdecomposing,forecasHng &combining EDA&Graphical Representa4on Forecas4ng Strategy Forecas4ng Decomposi4on components EDA&GraphicalRepresenta4on Learnaboutexploratorydataanalysis, scaKerplot,Hmeplot,lagplot,ACFplot Why Forecas4ng? Forecas4ngcomponents LearnaboutLevel,Trend,Seasonal, Cyclical,Randomcomponents Forecas4ngModels&Errors LearnaboutvariousforecasHng modelstobediscussed&thevarious errormeasures AGENDA
Why Forecasting Whyforecast,whenyouwouldknowtheoutcomeeventually? Earlyknowledgeisthekey,evenifthatknowledgeisimperfect – ForseQngproducHonschedules,oneneedstoforecastsales – Forstaffingofcallcenters,acompanyneedstoforecastthedemandforservice – Fordealingwithepidemicemergencies,naHonsshouldforecastthevariousflu • • © 2013 ExcelR Solutions. All Rights Reserved
Types of forecast ShortTerm orLongTerm MicroScale orMacro Scale Density Forecast Point Forecast Interval Forecast Forecas4ng Classifica4on Qualita4veor Quan4ta4ve Dataor Judgment © 2013 ExcelR Solutions. All Rights Reserved
Who generates Forecast? © 2013 ExcelR Solutions. All Rights Reserved
Who generates Forecast? © 2013 ExcelR Solutions. All Rights Reserved
Time series vs Cross-sectional data 01 Cross-sec4onalData 02 TimeSeriesData © 2013 ExcelR Solutions. All Rights Reserved
Dataset for further discussion Month Jan-91 Feb-91 Mar-91 Apr-91 May-91 Jun-91 Jul-91 Aug-91 Sep-91 Oct-91 Nov-91 Dec-91 Jan-92 Feb-92 Mar-92 Apr-92 May-92 Jun-92 Footfall in thousands 1709 1621 1973 1812 1975 1862 1940 2013 1596 1725 1676 1814 1615 1557 1891 1956 1885 1623 t=1,2,3,…....=Hmeperiodindex Yt=valueoftheseriesatHmeperiodt Yt+k=forecastforHmeperiodt+k,given dataunHlHmet et=forecasterrorforperiodt MonthlyFooWallsofcustomersfrom Jan1991toMarch2004 © 2013 ExcelR Solutions. All Rights Reserved
Forecasting Strategy 01 02 03 04 05 06 07 08 DefineGoal DataCollec4on Explore&VisualizeSeries Pre-ProcessData Par44onSeries ApplyForecas4ngMethod(s) Evaluate&ComparePerformance ImplementForecasts/System © 2013 ExcelR Solutions. All Rights Reserved
Forecasting Strategy – Step 1 #1 Is the goal descriptive or predictive? #2 What is the forecast horizon? • DescripHve=TimeSeries Analysis • Howfarintothefuture?kinYt+k • RollingforwardoratsingleHme point? • PredicHve=TimeSeries ForecasHng Define Goal #4 Forecasting expertise & automation #3 How will the forecast be used? • In-houseforecasHngor consultants? • Whoarethestakeholders? • Numericaloreventforecast? • Howmanyseries?Howofen? • Costofover-predicHon& under-predicHon • Data&sofwareavailability © 2013 ExcelR Solutions. All Rights Reserved
Forecasting Strategy – Step 2 #1DataQuality #2TemporalFrequency • Typicallysmallsample,soneed goodquality • Datasameasseriestobe forecasted • Shouldweusereal-HmeHcket collecHondata? • Balancebetweensignal&noise • AggregaHon/DisaggregaHon Data Collec-on #4.Domainexper4se #3SeriesGranularity? • NecessaryinformaHonsource • Affectsmodelingprocessfromstart toend • LevelofcommunicaHon/ coordinaHonbetweenforecasters& domainexperts • Coverageofthedata– Geographical,populaHon,Hme,… • Shouldbealignedwithgoal © 2013 ExcelR Solutions. All Rights Reserved
Forecasting Strategy Step3 (Explore Series) Season al PaHern s Addi4ve: Yt=Level+Trend+Seasonality+Noise Mul4plica4ve: Yt=LevelxTrendxSeasonalityxNoise Trend NON-SYSTEMATICPART Noise Level Seasonal PaHerns SYSTEMATIC PART © 2013 ExcelR Solutions. All Rights Reserved
Trend Component • Persistent,overallupwardordownwardpaKern • DuetopopulaHon,technologyetc. • OverallUpwardorDownwardMovement • SeveralyearsduraHon Response Mo., Qtr., Yr. © 2013 ExcelR Solutions. All Rights Reserved
Seasonal Component • RegularpaKernofup&downfluctuaHons • Duetoweather,customsetc. • Occurswithinoneyear • Example:Passengertrafficduring24hours Summer Response Mo., Qtr. © 2013 ExcelR Solutions. All Rights Reserved
Irregular/Random/Noise Component • ErraHc,unsystemaHc,‘residual’fluctuaHons • DuetorandomvariaHonorunforeseenevents – Unionstrike – War • ShortduraHon&nonrepeaHng © 2013 ExcelR Solutions. All Rights Reserved
Time Series Components © 2013 ExcelR Solutions. All Rights Reserved
Time Plot • PlotsavariableagainstHmeindex • Appropriateforvisualizingseriallycollecteddata(Hmeseries) • Bringsoutmanyusefulaspectsofthestructureofthedata • Example:ElectricalusageforWashingtonWaterPower (Quarterlydatafrom1980to1991) © 2013 ExcelR Solutions. All Rights Reserved
Time plot ElectricalpowerusageforWashingtonWaterPower:1980-1991 1100 1000 Powerusage(KilowaHs) 900 800 700 600 500 400 1980 1982 1984 1986 1988 1990 Year © 2013 ExcelR Solutions. All Rights Reserved
Observations • Thereisacyclictrend • Maximumdemandinfirstquarter;minimuminthirdquarter • Theremayalsobeaslowlyincreasingtrend(tobeexamined) • AnyreasonableforecastshouldhavecyclicfluctuaHons • Trend(ifany)needtobeuHlizedforforecasHng • Forecastwouldnotbeexact–therewouldbesomeerror © 2013 ExcelR Solutions. All Rights Reserved
Time plot © 2013 ExcelR Solutions. All Rights Reserved
Quarterly Sales of Ice-cream © 2013 ExcelR Solutions. All Rights Reserved
Scatter Diagram Cost 859 682 471 708 1094 224 320 651 1049 Age 8 5 3 9 11 2 1 8 12 • Plotsonevariableagainstanother • OneofthesimplesttoolsforvisualizaHon Example:MaintenancecostandAge forninebuses(SpokaneTransit) Thisisanexampleofcross-secHonal data(observaHonscollectedinasingle pointofHme) © 2013 ExcelR Solutions. All Rights Reserved
Scatter Plot 1200 Yearlycostofmaintenance(US$) 1000 800 600 400 200 0 0 2 4 6 Ageofbus 8 10 12 14 © 2013 ExcelR Solutions. All Rights Reserved
Observations • Olderbuseshavehighercostofmaintenance • ThereissomevariaHon(casetocase) • Theriseincostisabout$80peryearofage • Itmaybepossibletouse‘age’toforecastmaintenance cost • Forecastwouldnotbea‘certain’predicHon–therewould besomeerror © 2013 ExcelR Solutions. All Rights Reserved
Lag plot • Plotsavariableagainstitsownlaggedsample • BringsoutpossibleassociaHonbetweensuccessivesamples • Example:MonthlysaleofVCRsbyamusicstoreinayear =NumberofVCRssoldinHmeperiodt =NumberofVCRssoldinHmeperiodt–k © 2013 ExcelR Solutions. All Rights Reserved
Example of lagged variables Number of VCRs sold in a month Time 1 123 2 130 3 125 4 138 5 145 6 142 7 141 8 146 9 147 10 157 11 150 12 160 Original Laggedonestep 123 130 125 138 145 142 141 146 147 157 150 Laggedtwosteps 123 130 125 138 145 142 141 146 147 157 © 2013 ExcelR Solutions. All Rights Reserved
Lag plot (k = 1) ScaHerplotofVCRsaleswith1-steplaggedVCRsales 160 155 150 145 140 135 130 125 120 120 125 130 135 140 145 150 155 160 © 2013 ExcelR Solutions. All Rights Reserved
Observations • ThereisareasonabledegreeofassociaHon betweentheoriginalvariableandthelaggedone • Valueoflaggedvariableisknownbeforehand,so itisusefulforpredicHon • AssociaHonbetweenoriginalandlaggedvariable maybequan+fiedthroughacorrelaHon © 2013 ExcelR Solutions. All Rights Reserved
Autocorrelation • CorrelaHonbetweenavariableanditslagged version(oneHme-stepormore) =ObservaHoninHmeperiodt =ObservaHoninHmeperiodt–k =Meanofthevaluesoftheseries =AutocorrelaHoncoefficientfork-steplag © 2013 ExcelR Solutions. All Rights Reserved
Standard error of rk • Thestandarderroris The standard error of the mean esHmates the variability between samples whereas the standarddeviaHonmeasuresthevariabilitywithin asinglesample. • Increasesprogressivelywithk,buteventuallyreachesa maximumvalue • Ifthe‘true’autocorrelaHonis0,thentheesHmaterkshould beintheinterval(–2SE(rk),2SE(rk))95%oftheHme • SomeHmesSE(rk)isapproximatedby © 2013 ExcelR Solutions. All Rights Reserved
Correlogram or ACF plot • PlotstheACForAutocorrelaHonfuncHon(rk) againstthelag(k) • Plus-and-minustwo-standarderrorsare displayedaslimitstobeexceededforstaHsHcal significance • RevealslaggedvariablesthatcanbepotenHally usefulforforecasHng © 2013 ExcelR Solutions. All Rights Reserved
Correlogram for VCR data © 2013 ExcelR Solutions. All Rights Reserved
ACF plot for electricity usage data © 2013 ExcelR Solutions. All Rights Reserved
Observations • Everyalternatesampleislarge,manyofthem staHsHcallysignificantalso • ACFsatlags4,8,12,etcareposiHve • ACFatlags2,6,10etcarenegaHve • Allthesepickuptheseasonalaspectofthedata • Thedatamaybere-examinedafer‘removing’ seasonality © 2013 ExcelR Solutions. All Rights Reserved
ACF of de-seasoned KW data © 2013 ExcelR Solutions. All Rights Reserved
Observations • De-seasonedserieshassmallACFs • ThispartofthedatahasliKleforecasHngvalue © 2013 ExcelR Solutions. All Rights Reserved
Typical questions in exploratory analysis Is there a TREND? Alltheplotscontain informaHonregarding thesequesHons Is there a SEASONALITY? Are the data RANDOM? © 2013 ExcelR Solutions. All Rights Reserved
Time series plots © 2013 ExcelR Solutions. All Rights Reserved
Effect of omission of data on the Time series plot © 2013 ExcelR Solutions. All Rights Reserved
Effect of omission of data on the Time series plot © 2013 ExcelR Solutions. All Rights Reserved
Confusing kind of trend due to other type of scaling 20406080 20406080 y y 0 0 0 5 10 t 15 20 0 1 2 3 Log t 4.5 4.5 3.54 3.54 Log y Log y 2.53 2.53 0 5 10 t 15 20 0 1 2 3 Log t © 2013 ExcelR Solutions. All Rights Reserved
Few points on Plots Plothelpsustosummarize&revealpaKerns indata GraphicshelpustoidenHfyanomaliesindata Plothelpsustopresentahugeamountofdatain smallspace&makeshugedatasetcoherent Togetalltheadvantagesofplot,the“AspectRaHo” ofplotisverycrucial TheraHoofHeighttoWidthofaplotiscalled theASPECTRATIO © 2013 ExcelR Solutions. All Rights Reserved
Aspect Ratio • GenerallyaspectraHoshouldbearound0.618 • However,forlongHmeseriesdataaspectraHoshouldbe around0.25.TounderstandtheimpactofaspectraHoseethe twoplotsinthenexttwoslides © 2013 ExcelR Solutions. All Rights Reserved
Aspect ratio © 2013 ExcelR Solutions. All Rights Reserved
Aspect ratio © 2013 ExcelR Solutions. All Rights Reserved
Preliminaries for Step 3 of 8-Step forecasting strategy Shouldweuseall historicaldatafor forecas4ng ? Solu4on=DATAPARTIONING Fitthemodelonlyto TRAININGperiod TrainingData Valida4onData Assessperformanceon VALIDATIONperiod © 2013 ExcelR Solutions. All Rights Reserved
Partitioning DeploymodelbyjoiningTraining+ValidaHontoforecasttheFuture © 2013 ExcelR Solutions. All Rights Reserved
How to choose a Validation Period? Forecast Horizon Seasonality Strategytochoose Valida4onData Period Lengthof series Underlying condi4ons affec4ngseries © 2013 ExcelR Solutions. All Rights Reserved