Download
1 / 1
10 likes | 136 Vues
Sherif Abbas 1 , Mete Severcan 2 and Feride Severcan 1. Semi-automated features extraction from Fourier Transform Infrared spectra for biomedical artificial intelligence and statistical analysis. 1 Biology Department, Middle East Technical University, Ankara, Turkey

E N D
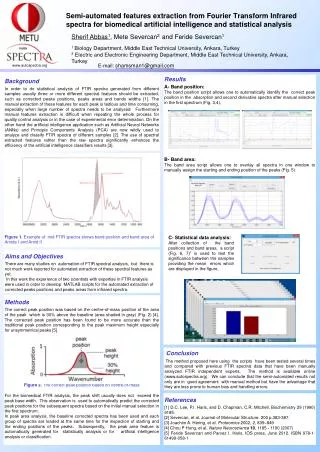
Sherif Abbas1, Mete Severcan2 and Feride Severcan1 Semi-automated features extraction from Fourier Transform Infrared spectra for biomedical artificial intelligence and statistical analysis 1 Biology Department, Middle East Technical University, Ankara, Turkey 2 Electric and Electronic Engineering Department, Middle East Technical University, Ankara, Turkey E-mail: shamsman1@gmail.com www.autospectra.org Background In order to do statistical analysis of FTIR spectra generated from different samples usually three or more different spectral features should be extracted, such as corrected peaks positions, peaks areas and bands widths [1]. The manual extraction of these features for each peak is tedious and time consuming, especially when large number of spectra needs to be analysed. Furthermore manual features extraction is difficult when repeating the whole process for quality control analysis or in the case of experimental error determination. On the other hand the artificial intelligence application such as Artificial Neural Networks (ANNs) and Principle Components Analysis (PCA) are now wildly used to analyze and classify FTIR spectra of different samples [2]. The use of spectral extracted features rather than the raw spectra significantly enhances the efficiency of the artificial intelligence classifiers results [3]. Results A- Band position: The band position script allows one to automatically identify the correct peak position in the absorption and second derivative spectra after manual selection in the first spectrum (Fig. 3,4). B- Band area: The band area script allows one to overlay all spectra in one window to manually assign the starting and ending position of the peaks (Fig. 5) Figure 1. Example of mid FTIR spectra shows band position and band area of Amide I and Amid II C- Statistical data analysis: After collection of the band positions and band areas, a script (Fig. 6, 7)” is used to test the significance between the samples providing the mean errors which are displayed in the figure. Aims and Objectives There are many studies on automation of FTIR spectral analysis, but there is not much work reported for automated extraction of these spectral features as yet. In this work the experience of two scientists with expertise in FTIR analysis were used in order to develop MATLAB scripts for the automated extraction of corrected peaks positions and peaks areas from infrared spectra. Methods The correct peak position was based on the centre-of-mass position of the area of the peak which is 30% above the baseline (area shaded in gray) (Fig. 2) [4]. The corrected peak position has been found to be more accurate than the traditional peak position corresponding to the peak maximum height especially for unsymmetrical peaks [5]. Figure 2.The correct peak position based on centre-of-mass For the biomedical FTIR analysis, the peak shift usually does not exceed the peak base width. This observation is used to automatically predict the corrected peak positions for the subsequent spectra based on the initial manual selection in the first spectrum. In peak area analysis, the baseline corrected spectra has been used and each group of spectra are loaded at the same time for the inspection of starting and the ending positions of the peaks. Subsequently, the peak area feature is automatically generated for statistically analysis or for artificial intelligence analysis or classification. Conclusion The method proposed here using the scripts have been tested several times and compared with previous FTIR spectral data that have been manually analyzed FTIR independent experts. The method is available online (www.autospectra.org). We can conclude that the semi-automated results not only are in good agreement with manual method but have the advantage that they are less prone to human bias and handling errors. References [1] D.C. Lee, P.I. Haris, and D. Chapman, C.R. Mitchell, Biochemistry 29 (1990) 9185. [2] Severcan, et al. Journal of Molecular Structure. 200 p.383-387. [3] Joachim A. Hering, et al. Proteomics 2002, 2, 839–849 [4] Chou P Hung, et al. Nature Neuroscience10, 1185 - 1190 (2007) [5] FerideSevercan and Parvez I. Haris. IOS press, June 2012. ISBN 978-1-61499-058-1