Download
1 / 1
10 likes | 129 Vues
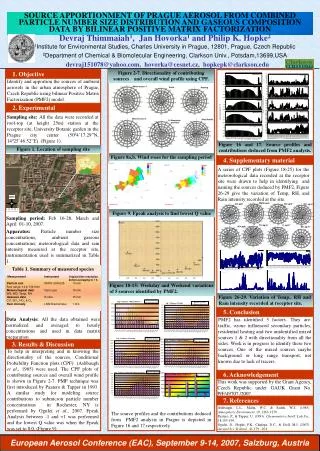
SOURCE APPORTIONMENT OF PRAGUE AEROSOL FROM COMBINED PARTICLE NUMBER SIZE DISTRIBUTION AND GASEOUS COMPOSITION DATA BY BILINEAR POSITIVE MATRIX FACTORIZATION. Devraj Thimmaiah 1 , Jan Hovorka 1 and Philip K. Hopke 2

E N D
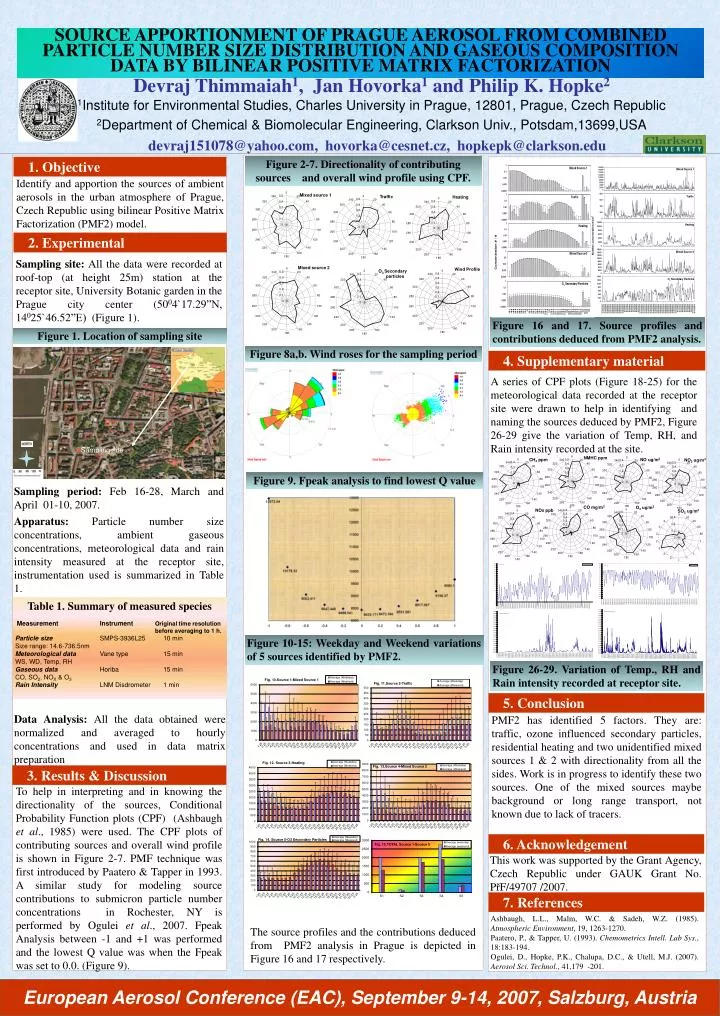
SOURCE APPORTIONMENT OF PRAGUE AEROSOL FROM COMBINED PARTICLE NUMBER SIZE DISTRIBUTION AND GASEOUS COMPOSITION DATA BY BILINEAR POSITIVE MATRIX FACTORIZATION Devraj Thimmaiah1, Jan Hovorka1 and Philip K. Hopke2 1Institute for Environmental Studies, Charles University in Prague, 12801, Prague, Czech Republic 2Department of Chemical & Biomolecular Engineering, Clarkson Univ., Potsdam,13699,USA devraj151078@yahoo.com, hovorka@cesnet.cz, hopkepk@clarkson.edu Figure 2-7. Directionality of contributing sources and overall wind profile using CPF. 1. Objective Identify and apportion the sources of ambient aerosols in the urban atmosphere of Prague, Czech Republic using bilinear Positive Matrix Factorization (PMF2) model. 2. Experimental Sampling site: All the data were recorded at roof-top (at height 25m) station at the receptor site, University Botanic garden in the Prague city center (5004`17.29”N, 14025`46.52”E) (Figure 1). Figure 16 and 17. Source profiles and contributions deduced from PMF2 analysis. Figure 1. Location of sampling site Figure 8a,b. Wind roses for the sampling period 4. Supplementary material A series of CPF plots (Figure 18-25) for the meteorological data recorded at the receptor site were drawn to help in identifying and naming the sources deduced by PMF2, Figure 26-29 give the variation of Temp, RH, and Rain intensity recorded at the site. Sampling site Figure 9. Fpeak analysis to find lowest Q value Sampling period: Feb 16-28, March and April 01-10, 2007. Apparatus: Particle number size concentrations, ambient gaseous concentrations, meteorological data and rain intensity measured at the receptor site, instrumentation used is summarized in Table 1. Table 1. Summary of measured species MeasurementInstrumentOriginal time resolution before averaging to 1 h. Particle sizeSMPS-3936L25 10 min Size range: 14.6-736.5nm Meteorological dataVane type 15 min WS, WD, Temp, RH Gaseous dataHoriba 15 min CO, SO2, NOX & O3 Rain IntensityLNM Disdrometer 1 min Figure 10-15: Weekday and Weekend variations of 5 sources identified by PMF2. Figure 26-29. Variation of Temp., RH and Rain intensity recorded at receptor site. 5. Conclusion Data Analysis: All the data obtained were normalized and averaged to hourly concentrations and used in data matrix preparation PMF2 has identified 5 factors. They are: traffic, ozone influenced secondary particles, residential heating and two unidentified mixed sources 1 & 2 with directionality from all the sides. Work is in progress to identify these two sources. One of the mixed sources maybe background or long range transport, not known due to lack of tracers. 3. Results & Discussion To help in interpreting and in knowing the directionality of the sources, Conditional Probability Function plots (CPF) (Ashbaugh et al., 1985) were used. The CPF plots of contributing sources and overall wind profile is shown in Figure 2-7. PMF technique was first introduced by Paatero & Tapper in 1993. A similar study for modeling source contributions to submicron particle number concentrations in Rochester, NY is performed by Ogulei et al., 2007. Fpeak Analysis between -1 and +1 was performed and the lowest Q value was when the Fpeak was set to 0.0. (Figure 9). 6. Acknowledgement This work was supported by the Grant Agency, Czech Republic under GAUK Grant No. PřF/49707 /2007. 7. References Ashbaugh, L.L., Malm, W.C. & Sadeh, W.Z. (1985). Atmospheric Environment, 19, 1263-1270. Paatero, P., & Tapper, U. (1993). Chemometrics Intell. Lab Sys., 18:183-194. Ogulei, D., Hopke, P.K., Chalupa, D.C., & Utell, M.J. (2007). Aerosol Sci. Technol., 41,179 -201. The source profiles and the contributions deduced from PMF2 analysis in Prague is depicted in Figure 16 and 17 respectively. European Aerosol Conference (EAC), September 9-14, 2007, Salzburg, Austria