Advances in X-Ray Spectral Analysis: Atomic Constants and Spectral Synthesis Techniques
780 likes | 891 Vues
This study by Tim Kallman and collaborators focuses on X-ray spectral analysis, emphasizing the importance of atomic constants and theoretical models. It discusses ionization calculations, kinematics, and the use of software like “xspec” for synthesizing spectral data. The paper reviews significant advancements made since 1996, including new computational techniques and databases like Chianti and atomdb. Experimental challenges, particularly in dielectronic recombination and collisional processes, are highlighted, alongside the necessity for accurate laboratory measurements to validate theoretical predictions.

Advances in X-Ray Spectral Analysis: Atomic Constants and Spectral Synthesis Techniques
E N D
Presentation Transcript
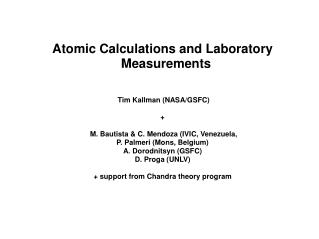
Tim Kallman (NASA/GSFC)+ M. Bautista & C. Mendoza (IVIC, Venezuela, P. Palmeri (Mons, Belgium) A. Dorodnitsyn (GSFC)D. Proga (UNLV)+ support from Chandra theory program Atomic Calculations and Laboratory Measurements
X-ray spectral analysis, part 1 Atomic constants Choose inputs (x, ..) Calculate Ionization, T.. Kinematics, geometry “xspec” Synthesize spectum “model” Instrument response Synthetic data no Agree? Observed data (pulse height) “Astrophysics”
X-ray spectral analysis, part 1 Atomic constants Choose inputs (x, ..) Calculate Ionization, T.. Kinematics, geometry “xspec” Synthesize spectum “model” Instrument response Synthetic data no Agree? Observed data (pulse height) “Astrophysics”
How did we get here? 1996: rates, codes and astrophysics 1999: atomic data needs for X-ray Astronomy 2005: XDAP then: raymond-smith: 49.8 kbytes now: atomdb: 135 Mbytes
theoretical tools Features: • Configuration interaction/superposition of configurations • Non-orthogonal orbitals • Semi-empirical corrections • Fully relativistic or Breit-pauli approximation to relativistic hamiltonian • Coupled to collisional-radiative code; very efficient caculation of radial part of matrix elements • Distorted wave scattering • Scattering: continuum wavefunctions calculated in close-coupling approximation Packages: • Cowan/ HFR • Z expansion • MCHF • MCDF/GRASP • Hullac • fac • Autostructure/superstructure • Rmatrix The algorithms are not new, but are enabled on a large scale by computing improvements + Databases: Chianti, atomdb, ornl, adas, topbase
Experimental tools • Traps (ebit) • Storage rings • Synchrotron light sources • (+beams)
Dielectronic recombination • challenges: • DR is a resonant process, need accurate resonant energies • Storage ring and ebit measurements: all L-shell ions of iron, M-shell under way (Savin et al.; Muller; Schippers … • These are key for verifying theory, and for demonstrating the importance of accurate resonance structure • Calculations: • Fac: total DR rates for H-Ne isosequences • Autostructure: state-resolved rates for isosequences He-Na (?)-like ions for elements He-Zn. (Badnell, Zatsarinny, Altun et al…) • Agreement with each other, and experiment, is ~20% Fe 18+-Fe17+ Savin et al. 2002
Sample fit to HETG Capella spectrum; xstar ionization balance
Collisional ionization O6+ O8+ • Challenges: • Rate from ground state is all that is needed for many purposes--> experiments can be used directly • Lotz --> Arnaud and Rothenflug --> Arnaud and Raymond --> Mazzotta: fit to early measurements… discrepancies? • Metastables can dominate • Storage ring experiments (Muller et al.) • Can eliminate metastables, due to ‘cold’ beam • Reveal important effects: REDA, EA Bryans et al. 2005 O5+; Muller et al. (2000)
Photoionization cross sections • Challenges • Need for inner shells, excited states (<--> RR) • Importance of resonances • Experiment: • Synchrotron/ion beams • calculations • Rmatrix (iron project) • autostructure Champeaux et al. 2003; Nahar 2004
Ionization balance • Bryans et al. 2005 • Put together Autostructure DR rates+ collisional ionization rates for elements
spectra • Accurate wavelengths are key to line ids, and to anchoring semi-empirical structure calculations • Theoretical calculations are not (generally) accurate enough to distinguish lines in rich X-ray spectra • Lab measurements are key • Ebit has been a leader in this field Ni L-shell ion spectra; Gu et al. 2007 Calculated vs. measured line wavelengths
Needs • Auger • Following inner shell ionization, cascade of electrons • Correlated line emission? • Charge exchange: ‘non-traditional’ X-ray sources: planets, solar system objects • Trace elements • Protons • Thermal: angular momentum changing collisions • Non-thermal: spectral signatures of cosmic rays. • Dust/molecules/low ionization gas: inner shells • Inner shells: inner shell lines, photoionization cross sections, collision strengths • Collisional ionization: loose ends? • Collisional processes away from equilibrium peak?
X-ray spectral analysis Atomic constants Choose inputs (x, ..) Calculate Ionization, T.. Kinematics, geometry “xspec” Synthesize spectum “model” Instrument response Synthetic data no Agree? Observed data (pulse height) “Astrophysics”
Test out models using the 800 ksec observation of NGC 3783 (Kaspi et al. 2001, 2002; Krongold et al. 2003; Chelouche and Netzer 2005
Start with a single photoionized component pure absorption Choose single turbulent width to fit majority of lines, vturb=300 km/s use z=0.007, compare with zngc3783=0.00938 --> voutflow=700 km/s Best fit ionization parameter: log~2. photoionized models
Al XII Al XIII
pure absorption photoionized models: multiple x components • 2 Component Fit, • log2. (as before) • log~ 0. (produces Fe M shell UTA) • Other parameters the same as single component: • z=0.007, • vturb=300 km/s
What if we try a Continuous distribution of ionization parameter, 0.1<log2.4? --> Complete ruled out
‘Photoionization Models’ • Full global model • (i.e. photoionization-->synthetic spectrum --> xspec --> fit) • Xstar version 2.1ln2 • Inner M shell 2-3 UTAs (FAC; Gu); >400 lines explicitly calculated • Chianti v. 5 data for iron L • Iron K shell data from R-matrix calculations(Bautista, Palmeri, Mendoza et al) • Available from xstar website, as are ready-made tables • Not in current release version, 2.1kn7 • Other models have similar ingredients • Xspec ‘analytic model’ warmabs • Not fully self consistent: assumes uniform ionization absorber, but this is small error for low columns. • http://heasarc.gsfc.nasa.gov/xstar/xstar.html
X-ray spectral analysis Atomic constants Choose inputs (x, ..) Calculate Ionization, T.. Kinematics, geometry “xspec” Synthesize spectum “model” Instrument response Synthetic data no Agree? Observed data (pulse height) “Astrophysics”
Now try absorption + thermal emission photoionized models • Add component due to 'thermal' photoionization (i.e. Recombination+collisional excitation processes): ‘photemis’ • Component has redshift z=0.009, I.e. redshift of object
Now try photoionized scattering models • Photemis model does not account for scattered emission • To test this, we apply method from theory of hot star winds, (SEI) method (Lamers et al. 1992) assumes ordered, radial supersonic flow • Apply SEI profile to all spectrum lines, with depth parameter proportional to depth calculated by warmabs. • Free parameter is ratio of scattered emission to absorption, C.
Wind models O VIII La requires C~1
Fit is generally worse, owing to overestimate of scattered emission for C>0.5
Now try multicomponent models Ncomponents=C vturb/vtherm • Multabs is an attempt to test whether multiple discrete components can mimic a single feature. • Several identical warmabs components, each with thermal width are spread evenly across an energy interval determined by vturb • The number is determined by a 'covering fraction', C=1 corresponds to a black trough, C=0 corresponds to one thermal component
This affects the Curve of growth; eg. For O VIII La, vturb=300, vtherm=60, C=1, a=0.01 Multiple components Single line Line center optical depth
Fit is worse than for single turbulently broadened component.. Due to COG effects
A summary of 2/8192 The pure absorption 2 component model looks best…
X-ray spectral analysis: a different procedure Choose inputs Atomic constants Density, T, flux Calculate Ionization. Dynamical model “xspec” Synthesize spectum “model” Instrument response Synthetic data no Agree? Observed data (pulse height) “Astrophysics”