Download
1 / 49
500 likes | 641 Vues
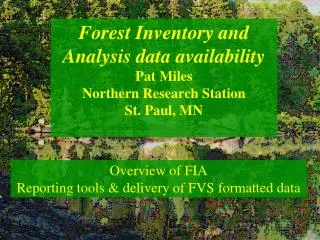
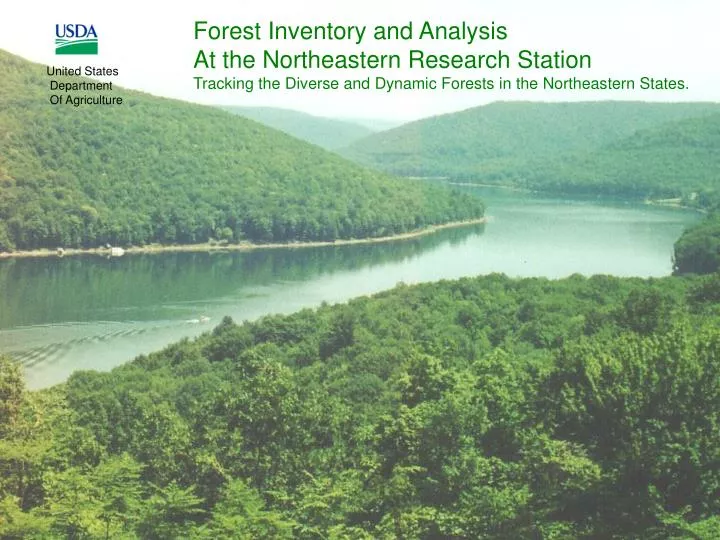
Forest Inventory and Analysis At the Northeastern Research Station Tracking the Diverse and Dynamic Forests in the Northeastern States. United States Department Of Agriculture. Forest Service Northeastern Research Station. FIA is the Nation's forest census . .

E N D
Forest Inventory and Analysis At the Northeastern Research Station Tracking the Diverse and Dynamic Forests in the Northeastern States. United States Department Of Agriculture Forest Service Northeastern Research Station
FIA is the Nation's forest census. • Whether you’re interested in wildlife habitat, evaluating sustainability of forestry practices, or studying global warming and need to estimate the uptake of carbon dioxide by forests, you need good data and information to analyze and make decisions. The FIA project is a response to that need. • FIA is a National program that, conducts and maintains comprehensive inventories of the forest resources in the United States.
PERCENTAGE OF LAND IN FOREST 90% AND NUMBER OF FIA PLOTS 3327 78% 997 89% 967 62% 62% 845 5091 60% 522 59% 225 59% 4839 30% 45% 805 4415 30% 208 78% 41% 1060 2600 The Northeast FIA Unit Inventories The Forest In 13 States
Why is FIA Important? • FIA provides objective and scientifically credible information on key forest ecosystem processes: • how much forest there is, • what it looks like, • whether the forest area is increasing or decreasing, • whether we are gaining or losing species, • and how quickly trees are growing, dying, and being harvested. :
How an inventory is conducted. • The FIA project does not count every tree in the Northeast. Instead, they use a scientifically designed sampling method. Data’s collected in three phases, with each phase taking a closer look at the forest.
How the inventory is conducted. • The FIA project does not count every tree in the Northeast. Instead, they use a scientifically designed sampling method. Data’s collected in three phases, with each phase taking a closer look at the forest.
Phase 1 (P1) • Phase 1 (P1) uses satellite imagery to classify the entire area of a state into forest and nonforest land cover categories. These estimates are used to statistically expand the data collected in phase 2 (P2) to the state or individual county level.
Phase 2 • Phase 2 is a network of ground plots that are visited by trained field crews. This network of permanently established plots is on a grid spaced approximately 3.1 miles apart across the entire country.
Five-Year Panel Year One Year Two Year Three Year Four Year Five 1 2 3 4 5 3 1 4 5 1 2 3 1 2 3 4 5 3 1 4 5 1 2 3 Phase Two – Sampling Frame Interpenetrating Design Sample Intensity = 1 sample location per 5,933 acres of land Inventory Cycle Length = Five years or 20 percent of the sample locations each year.
Subplot 2 Subplot: 24.0 ft radius 120.0 ft Subplot 1 Microplot: 6.8 ft radius Annular plot: Subplot 4 Subplot 3 58.9 ft radius P2 & P3 Plot Design
On all our field plots, we gather measurements that describe • General land use • Tree diameter, height, damage, amount of rotten or missing wood, and tree quality • Counts of tree regeneration
General stand characteristics such as forest type, stand age, and disturbance • Estimates of growth, mortality, and removals (determined by revisiting plots from the previous time period)
One out of every 16, P2 plots, is chosen to be a phase 3 (P3) plot. Phase 3 plots are only measured during the summer Phase 3 • Crown condition • Soil condition • Vegetation diversity and structure • Down woody debris • Lichen communities • Ozone injury • Tree damage
Publications Accessing data on Web Spatial Data Service Center Call us with special requests Using Mapmaker application on Web Data Access and Analysis
Major Trends in Forest Resource and Other Interesting Results
Percent Forest 0 - 20 20 - 40 40 - 60 60 - 80 80 - 100 Percentage of Land in Forest by County
Percent Public Ownership 0 - 10 10 - 20 20 - 30 30 - 40 > 40 Percentage of Forest Land in Public Ownerships
Change in Forest Land in the Chesapeake Bay watershed by Region Currently forest land totals 26.5 million acres in the watershed, +0.7% from previous estimates.
Timberland area by stand-size class in the Chesapeake Bay Watershed
Portion of Total Growing-stock Volume Composed of Oak Species, Current and Previous Inventories
Oaks are an important species for wildlife and lumber in PennsylvaniaRecent inventories show a decline in the number of small oaks and an increase in large diameter oaks.
Percentage of Oak Stems by Diameter Class in the Chesapeake Watershed
Volume per acre (Cubic feet) < 1500 1500 - 2000 2000 - 2500 2500 - 3000 > 3000 Average Volume of Trees Per Acre of Timberland
The Survey Instrument • Woodland characteristics • Ownership objectives • Forest management and education • Concerns and issues • Future intentions • Demographics
Number of family forest owners in the Chesapeake Bay watershed by size of ownership, 2003
Acres of family forest owners in the Chesapeake Bay watershed by size of ownership, 2003
Percentage of numbers of owners and acreage by size of ownerships for family owned forests in the Chesapeake watershed, 2003
Area and number of family owned forests in the Chesapeake Bay watershed with written management plan, 2003
Land tenure of family forests in the Chesapeake Bay watershed by years of ownership, 2003 Percent of Acreage Years of Ownership
Age of family forest owners in the Chesapeake Bay watershed, 2003 Percent of Respondents Age of Owner (Years)
COMPONENTS OF VOLUME CHANGE, 1987-99, MARYLAND Gross Growth – Mortality +/- Change in cull = Net Growth Net Growth – Removals = Net Change
Rich Widmann USDA Forest Service Forest Inventory & Analysis 11 Campus Boulevard, Suite 200 Newtown Square, PA 19073 E-mail rwidmann@fs.fed.us Office 610-557-4051