Mendelian Genetics
Mendelian Genetics. Genetic Definitions. Genes - genetic material on a chromosome that codes for a specific trait Genotype - the genetic makeup of the organism Phenotype- the expressed trait Allel- an alternative form of a gene. Dominance Mechanism Two alleles are carried for each trait

Mendelian Genetics
E N D
Presentation Transcript
Genetic Definitions • Genes- genetic material on a chromosome that codes for a specific trait • Genotype- the genetic makeup of the organism • Phenotype- the expressed trait • Allel- an alternative form of a gene
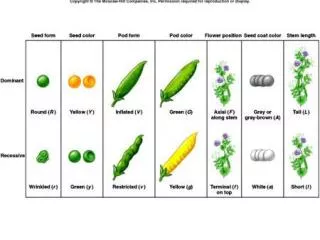
Dominance Mechanism • Two alleles are carried for each trait • In true-breeding individuals, both alleles are the same (homozygous). • Hybrids, on the other hand, have one of each kind of allele (heterozygous). • One trait is dominant, the other trait is recessive
Mendel’s Three Principles • Dominance • Segregation • Independent Assortment (1822-1884) The foundation of “classical” science
Frequency 150 purple • Proportion 150:200 • Percentage 75% purple • Ratio 3:1 150 purple kernels 50 yellow kernels Total 200 kernels
This laboratory activity is designed to familiarize you with the statistical nature of Mendel's model.
Part I We will attempt to understand the probabilistic aspects of monohybrid crosses (Mendel’s Law of Segregation) by "randomly" tossing special "coins" designed to simulate the genotypes of parents, focusing on a single genetic character, seed color.
Part II We will attempt to understand the probabilistic aspects of dihybrid crosses (Mendel’s Law of Independent Assortment) by “randomly” tossing special “dice” designed to simulate the genotypes of parents, focusing on two genetic characters, seed color and plant height.
In Part III, we will investigate various human genetic characters.
In Part IV, we will also evaluate the results of monohybrid and dihybrid crosses involving the characteristics of corn seeds.
In Part V, we will learn about the use of the Chi-Square test for statistical hypothesis testing. (o – e)2 c2 =∑ e
Parts I-III of this lab activity will involve collection of class data. So we will proceed through these parts together as a class. But each round of data collection will involve working in pairs. Parts IV & V will not involve collection of class data. You will proceed through these parts working in pairs.
Tongue Roller R = Tongue Rollerr = Unable to Roll Tongue
Widow’s Peak W = Widows Peakw = Lack of Widow’s Peak
Attached Ear Lobe Free Ear Lobe E = Free Ear Lobee = Attached Ear Lobe
Hitchhiker’s Thumb Hi = Straight Thumbhi = Hitchhiker’s Thumb
Bent Little Finger Bf = Bent Little Fingerbf = Straight Little Finger
Mid-digital Hair M = Mid-Digital Hairm = Absence of Mid-Digital Hair
Dimples D = Dimplesd = Absence of Dimples
Short Hallux Ha = Short Halluxha = Long Hallux
Short Index Finger Ss = Short Index FingerS1 = Long Index Finger *Sex-Influenced Trait
The Chi Square Test • A statistical method used to determine goodness of fit • Goodness of fit refers to how close the observed data are to those predicted from a hypothesis • Note: • The chi square test does not prove that a hypothesis is correct • It evaluates to what extent the data and the hypothesis have a good fit
The Chi Square Test • The general formula is (o – e)2 c2 =∑ e • where • o = observed data in each category • e = observed data in each category based on the experimenter’s hypothesis • ∑ = Sum of the calculations for each category
We start with a theory for how the offspring will be distributed: the “null hypothesis”. The null hypothesis is that the offspring will appear in a ratio of 3/4 dominant to 1/4 recessive.
Example of its use: Observed Expected* Frequency Frequency (o) (e) red flowers 73 75 white flowers 27 25 *The expected frequency depends upon the hypothesis.
o - e (o - e )2(o - e ) 2 e red flowers -2 4 0.053 white flowers 2 4 0.16 (O – E)2 c2 =∑ = 0.053 + 0.16 = 0.213 E
Degrees of Freedom • A critical factor in using the chi-square test is the “degrees of freedom”, which is essentially the number of independent random variables involved. • Degrees of freedom is simply the number of classes of offspring minus 1 (d.f. = n-1). • For our example, there are 2 classes of offspring: red and white. Thus, degrees of freedom (d.f.) = 2 -1 = 1.
Critical Chi-Square • Critical values for chi-square are found on tables, sorted by degrees of freedom and probability levels. Be sure to use p = 0.05. • If your calculated chi-square value is greater than the critical value from the table, you “reject the null hypothesis”. • If your chi-square value is less than the critical value, you “fail to reject” the null hypothesis (that is, you accept that your genetic theory about the expected ratio is correct).
Your value Chi-Square Table 2 = 0.213 probability Do you accept or reject the null hypothesis?