Download
1 / 55
550 likes | 669 Vues
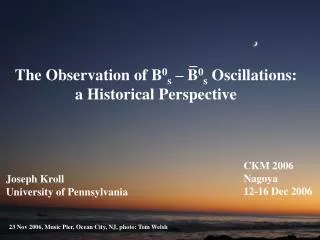
The Observation of B 0 s – B 0 s Oscillations: a Historical Perspective. CKM 2006 Nagoya 12-16 Dec 2006. Joseph Kroll University of Pennsylvania. 23 Nov 2006, Music Pier, Ocean City, NJ, photo: Tom Welsh. Our Story Begins 20 Years Ago. UA1 1986: Evidence for B 0 & B 0 s mixing.

E N D
The Observation of B0s – B0s Oscillations:a Historical Perspective CKM 2006 Nagoya 12-16 Dec 2006 Joseph Kroll University of Pennsylvania 23 Nov 2006, Music Pier, Ocean City, NJ, photo: Tom Welsh
Our Story Begins 20 Years Ago UA1 1986: Evidence for B0 & B0s mixing Phys. Lett. B 186, 247 (1987) From the Abstract: “Combined with the null result from searches for B0$ B0 oscillations at e+e- colliders, our results are consistent with with transitions in the B0s system as favoured theoretically” (the B0s had not even been observed yet) J. Kroll (Penn)
Neutral Meson Flavor Oscillations (Mixing) 1954: over 50 years ago Due to phase space suppression: K0L very long-lived: 5.2£ 10-8 s (K0S: 0.0090£ 10-8 s) J. Kroll (Penn)
Long-Lived Neutral Kaon Discovered in 1956 Led to discovery of CP Violation in 1964 (Nobel Prize in 1980) BF(K0L!+-) = 0.2% Christenson, Cronin, Fitch, Turlay, Phys. Rev. Lett. 13, 138 (1964) J. Kroll (Penn)
Neutral Meson Mixing (Continued) “If there is any place where we have a chance to test the main principles of quantum mechanics in the purest way – does the superposition of amplitudes work or doesn’t it – this is it.” R. P. Feynman in Lectures on Physics Vol. III J. Kroll (Penn)
Common decay modes ! 2-state QM system Eigenstates of 2-state system (neglecting CP violation) “Light” (CP-even) “Heavy” (CP-odd) Start (t=0) with particle Antiparticle exists at time t! Two-State Quantum Mechanical System mass & width J. Kroll (Penn)
Importance of Neutral B Meson Oscillations fundamental parameters that must be measured Cabibbo-Kobayashi-Maskawa Matrix mass weak Oscillation frequencies (md, ms) determine poorly known Vtd, Vts |Vtd| & |Vtd/Vts| measure one side of Unitary Triangle New particles in loops alter expectations test Standard EWK Model J. Kroll (Penn)
All factors well known except from Lattice QCD calculations (Okamoto, hep-lat/0510113) Limits precision on Vtd, Vts to ~ 10% Theoretical uncertainties reduced in ratio: ~ 4% PDG 2006 J. Kroll (Penn)
Some History Important prehistory: 1983: long B hadron lifetime 2006 APS Panofsky Prize 1986: 1st evidence of B mixing from UA1 C. Albajar et al., PLB, 186, 247 (1987) 1987: Definitive observation of B0 mixing by ARGUS - indicates UA1 must be Bs, heavy top (>50 GeV) - 1989 confirmed by CLEO H. Albrecht et al., PLB, 192, 245 (1987) M. Artuso et al., PRL, 62, 2233 (1989) 1990’s: LEP, SLC, Tevatron - time-integrated meas. establishes Bs mixes (maximally) - measure time-dependent B0 oscillations - lower limits on Bs oscillation frequency too many references to list individually 2000: B factories improve precision of B0 oscillation frequency Belle: K. Abe et al., PRD 71, 072003 (2005) Babar: B. Aubert et al., PRD 73, 012004 (2006) 2006: Tevatron discovers Bs oscillations - two-sided 90% CL limit by DØ - 1st measurement of oscillation frequency by CDF - definitive observation of oscillation signal by CDF V. M. Abazov et al., PRL, 97, 021802 (2006) A. Abulencia et al., PRL, 97, 021802 (2006) & PRL, 97, 242003 (2006) J. Kroll (Penn)
b sample e, c sample thrust axis 100m background 500m 1983: B Hadron Lifetime Measurement 2006 Panofsky Prize: Bill Ford, John Jaros, Nigel Lockyer Signed impact parameter (no Silicon) SLD: xy = 3.5m Z = 17m MarkII: N. Lockyer et al., PRL 51 1316 (1983) MAC: E. Fernandez et al., PRL 51 1022 (1983) J. Kroll (Penn)
Measure probability B decays as B: Measure probability B decays as B as a function of proper decay time t Methods to Measure m Time Integrated (assuming =0) Mixing first established with time integrated quantities Time Dependent (required for m À ) (LEP, LHC, SLC, Tevatron) m = oscillation frequency J. Kroll (Penn)
First Time Integrated Measurements Based on semileptonic B decay: Correct for: Coherent incoherent J. Kroll (Penn)
UA1: 1st Evidence for B Mixing Measured: for no mixing Expected: Found: no mixing disfavored at 2.9 C. Albajar et al., Phys. Lett. B 186, 247 (1987) J. Kroll (Penn)
ARGUS: Observation of B0 Oscillations 1 fully reconstructed event with two B0’s (two +) Measured d using r from - dileptons (4.0) - lepton+B0’s (3.0) unknown: B0 to B+ ratio H. Albrecht et al., PLB, 192, 245 (1987) J. Kroll (Penn)
B0s Mixing Established Example: OPAL Early ’90’s: Z-pole, hadron R. Akers et al., ZfP, C60, 199 (1993) Extracted: Bs mixing probability Data favor maximal s Bs mixing “discovered” + d from CLEO Fraction of Bs mesons produced J. Kroll (Penn)
Signal Well known background poorly known background (small) 1992: First Direct Evidence of Bs P. Abreu et al. (Delphi) Phys. Lett. B 289, 199 (1992) also: D. Buskulic et al. (Aleph) Phys. Lett. B 294, 145 (1992) P. D. Acton et al. (Opal) Phys. Lett. B 295, 357 (1992) Sample: 270 K hadronic Z J. Kroll (Penn)
Time Dependent Measurement of md • Requires 3 pieces of information per event • Flavor of B at production • Flavor of B at decay • Proper decay time of B • Flavor of B at production – several techniques • from other B hadron in event: leptons, jet-charge, kaons • use associated particles produced in fragmentation • Flavor of B at decay – depends on reconstruction • inclusive (reconstruct secondary vertex, use “jet-charge”) • partial (lepton, charm) • semi-exclusive or exclusive (lepton+charm, hadronic) • Proper decay time • resolution depends on method of reconstructing B decay J. Kroll (Penn)
ALEPH: 1st Time Dependent Measurement lepton tag from “other” B Experimental Effects Measured Asymmetry perfect D proper time effects prod. flavor mistag, backgnd D0 Decay Length (cm) J. Kroll (Penn) R. Akers et al., ZfP, C60, 199 (1993)
State of the Art: md J. Kroll (Penn)
How Do We Measure Oscillation Frequency? Measure asymmetry A as a function of proper decay time t “unmixed”:particle decays as particle “mixed”:particle decays as antiparticle For a fixed value of ms, data should yield Amplitude “A” is 1 @ true value of ms Amplitude “A” is 0 otherwise Amplitude method: H-G. Moser, A. Roussarie, NIM A384 p. 491 (1997) Units: [m] = ~ ps-1, ~=1 then m in ps-1. Multiply by 6.582£ 10-4 to convert to eV J. Kroll (Penn)
Start 2006: Published Results on ms >3.4 cycles per lifetime source: http://www.slac.stanford.edu/xorg/hfag/osc/PDG_2006/index.html Results from LEP, SLD, CDF I ms > 14.4 ps-1 95% CL Amplitude 1 0 Average 0.48 § 0.43 Amplitude @ ms = 15 ps-1 15 Frequency ms (ps-1) J. Kroll (Penn)
April 2006: Result from the CDF Collaboration A. Abulencia et al., Phys. Rev. Lett., 97, 062003 (2006) Probability that random fluctuations mimic this signal is 0.2% (3) Assuming signal hypothesis: measure ms likelihood ratio Since then goal has been to observe signal with > 5 significance J. Kroll (Penn)
Ingredients in Measuring Oscillations Decay mode tags b flavor at decay opposite-side K– jet charge 2nd B tags production flavor Proper decay time from displacement (L) and momentum (p) Dilution D = 1 – 2w w = mistag probability = efficiency D2 = effective tagging power J. Kroll (Penn)
CDF’s strengths Key Experimental Issues Uncertainty on Amplitude efficient tracking, displaced track trigger Signal size Signal to Background excellent mass resolution Particle ID: TOF, dE/dx Production flavor Tag performance lepton id, Kaon id with TOF Silicon on beampipe (Layer 00) Proper time Resolution Fully reconstructed signal crucial J. Kroll (Penn)
Improvements that led to Observation • Same data set (1 fb-1) • Proper decay time resolution unchanged • Signal selection • Neural network selection for hadronic modes • add partially reconstructed hadronic decays • use particle id (TOF, dE/dx) (separate kaons from pions) • looser kinematic criteria possible due to lower background • additional trigger selection criteria allowed • Production Flavor tag • opposite-side tags combined using neural network • also added opposite-side kaon tag • neural network combines kinematics and PID in same-side K tag J. Kroll (Penn)
Example: Fully Reconstructed Signal Cleanest decay sequence Add partially reconstructed decays: Also use 6 body modes: Hadronic signal increased from 3600 to 8700 J. Kroll (Penn)
Semileptonic Signals Semileptonic signal increased from 37000 to 61500 J. Kroll (Penn)
<t> = 86 £ 10-15 s ¼ period for ms = 18 ps-1 Oscillation period for ms = 18 ps-1 Decay Time Resolution: Hadronic Decays Maximize sensitivity: use candidate specific decay time resolution Superior decay time resolution gives CDF sensitivity at much larger values of ms than previous experiments J. Kroll (Penn)
Correction Factor (MC) Decay Time Reconstructed quantity Semileptonics: Correction for Missing Momentum resolution (fs) T = 2/ms proper decay time (ps) Reconstructed momentum fraction J. Kroll (Penn)
Same Side Flavor Tags Charge of K tags flavor of Bs at production Need particle id TOF Critical (dE/dx too) Our most powerful flavor tag: D2 = 4-5% (Opposite-side tags: D2 = 1.8%) J. Kroll (Penn)
Results: Amplitude Scan Sensitivity 31.3 ps-1 A/A = 6.1 Hadronic & semileptonic decays combined J. Kroll (Penn)
Measured Value of ms Hypothesis of A=1 compared to A=0 - log(Likelihood) J. Kroll (Penn)
Significance: Probability of Fluctuation Probability of random fluctuation determined from data 28 of 350 million random trials have L < -17.26 Probability = 8 £ 10-8(5.4) Have exceeded standard threshold to claim observation -17.26 J. Kroll (Penn)
Asymmetry (Oscillations) in Time Domain Period 0.35 ps Aside: for B0 Period = 12.6 ps J. Kroll (Penn)
Summary of CDF Results on B0s Mixing A. Abulencia et al., hep-ex/0609040, accepted by Phys. Rev. Lett. Observation of Bs Oscillations and precise measurement of ms Precision: 0.7% Probability random fluctuation mimics signal: 8£10-8 ( 2.83 THz, 0.012 eV) Most precise measurement of |Vtd/Vts| 20 year quest has come to a conclusion J. Kroll (Penn)
Backup Slides J. Kroll (Penn)
Key Features of CDF for B Physics • “Deadtime-less” trigger system • 3 level system with great flexibility • First two levels have pipelines to reduce deadtime • Silicon Vertex Tracker: trigger on displaced tracks at 2nd level • Charged particle reconstruction – Drift Chamber and Silicon • excellent momentum resolution: R = 1.4m, B = 1.4T • lots of redundancy for pattern recognition in busy environment • excellent impact parameter resolution (L00 at 1.5cm, 25m £ 25m beam) • Particle identification • specific ionization in central drift chamber (dE/dx) • Time of Flight measurement at R = 1.4 m • electron & muon identification J. Kroll (Penn)
Time of Flight Detector (TOF) Kaon ID for B physics • 216 Scintillator bars, 2.8 m long, 4 £ 4 cm2 • located @ R=140 cm • read out both ends with fine mesh PMT • (operates in 1.4 T B field – gain down ~ 400) • anticipated resolution TOF=100 ps • (limited by photostatistics) Measured quantities: s = distance travelled t = time of flight p = momentum Derived quantities: v = s/t m = p/v J. Kroll (Penn)
B Flavor Tagging We quantify performance with efficiency and dilution D = fraction of signal with flavor tag D = 1-2w, w = probability that tag is incorrect (mistag) Statistical error A on asymmetry A (N is number of signal) statistical error scales with D2 J. Kroll (Penn)
Produce bb pairs: find 2nd b, determine flavor, infer flavor of 1st b Two Types of Flavor Tags Opposite side + Applicable to both B0 and B0s −other b not always in the acceptance Same side Based on fragmentation tracks or B** + better acceptance for frag. tracks than opp. side b −Results for B+ and B0not applicable to B0s Reminder: for limit on ms must know D J. Kroll (Penn)
jet from b (b) has negative (positive) charge on average Types of Opposite Side Flavor Tags Lepton tags low high D mistags from Jet charge tag high low D Kaon tag Not used in present analysis Largest D2 @ B factories TOF J. Kroll (Penn)
Calibrate with Large Statistics Samples of B+ & B0 Example: semileptonic signals Results: D2 = 1.54 § 0.05 [ md = 0.509 § 0.010 (stat) § 0.016 (syst)] Hadronic signals: B+ (D0+) = 26,000 B0 (D-+) = 22,000 J. Kroll (Penn)
Compare PerformanceData and Simulation Check prediction for kaon tag on B+, B0 K Good agreement between data & MC Systematic based on comparisons K J. Kroll (Penn)
Flavor Tagging Summary Same-side kaon tag increases effective statistics £ 3 – 4 J. Kroll (Penn)
Systematic Uncertainties on ms • systematic uncertainties from fit model evaluated on toy Monte Carlo • have negligible impact • relevant systematic unc. from lifetime scale All relevant systematic uncertainties are common between hadronic and semileptonic samples J. Kroll (Penn)
Based on correlation between charge of fragmentation particle and flavor of b in B meson Same Side Flavor Tags TOF Critical (dE/dx too) Both due to PENN J. Kroll (Penn)
Kaons Produced in Vicinity of B’s Larger fraction of Kaons near B0s compared to B0, B+, as expected Ph. D. Thesis, Denys Usynin J. Kroll (Penn)
candidate Example of Candidate Zoom in on collision pt. Same-side Kaon tag Opposite-side Muon tag J. Kroll (Penn)
Measuring Resolution in Data Use large prompt D meson sample CDF II, D. Acosta et al., PRL 91, 241804 (2003) Real prompt D+ from interaction point pair with random track from interaction point Compare reconstructed decay point to interaction point J. Kroll (Penn)
Decay position production vertex 25m £ 25 m Decay time in B rest frame Proper Time & Lifetime Measurement J. Kroll (Penn)