Download
1 / 13
130 likes | 168 Vues
This study focuses on a new model of cerebral blood flow dynamics in the Circle of Willis with auto-regulation features to assess stroke risk quickly before medical procedures. It integrates non-linear feedback control using a simplified geometric representation. The model's accuracy is verified against clinical and research data through various simulations, including high-stroke risk scenarios. The results highlight the model's effectiveness in predicting changes in flow rates and pressure, offering insights for personalized risk assessments. Future research aims to enhance physiological accuracy and expand structural modeling.

E N D
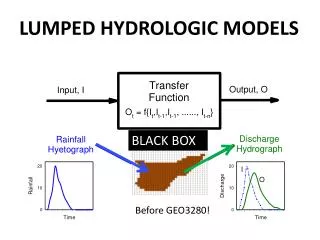
Lumped Parameter and Feedback Control Models of the Auto-Regulatory Response in the Circle of Willis World Congress on Medical Physics and Biomedical Engineering 2003 K T Moorhead, C V Doran, J G Chase, and T David Department of Mechanical Engineering University of Canterbury Christchurch, New Zealand
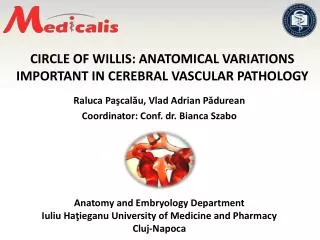
Structure of the CoW • Geometry • Purpose of CoW • Auto-regulation • > 50% do not have a complete CoW! CFD model of the CoW
Research Goals • Desire: Better understand haemodynamics in the Circle of Willis (CoW) cerebral arterial system • Realistic dynamics for auto-regulation • Match existing clinical data • Goal: Create a simplified model of CoW haemodynamics to assist in rapid diagnosis of stroke risk patients prior to surgery or other procedures • Computationally simple • Flexible • Previous Work • No auto-regulation (Hillen et al. 1988; Cassot et al. 2000) • Steady state solution (Ursino and Lodi 1999; Hudetz et al. 1982) In contrast, our model focuses on the transient dynamics
+ve R P2 P1 q Modeling the CoW Poiseuille Flow Constant resistance between nodes captured by simple circuit analogy: Leads to system of linear equations for flow rates q(t) due to input conditions P(t): Ax(t) = b(t) Simplified geometry schematic of arterial system for basic dynamic analysis
Standard PID feedback control law Resistance dynamics of contraction/dilation Amount of change is limited Auto-Regulation Model q ¹ qref • Pressure/flow difference sensed • Ca2+ released into cytoplasm • Muscle contraction • Contracting/Dilating vessel radius • Changing resistance of vessels vessel wall Ca2+ smooth muscle cells Error in flowrate NO YES q = qref? Change in control input Calculate new flowrate System is nonlinear: A(x(t))*x(t) = b(t) Change in resistance
Simulations and Model Parameters • Reference and constant resistances based on known physiological data • Physiological data from thigh cuff experiments is used to determine control gains • Efferent resistances follow the ratio (6:3:4) for the ACA:MCA:PCA in the steady state (Hillen et al., 1986) • 20 sec response time for a 20% pressure drop (Newell et al., 1994 ) • Drop in RICA of 20mmHg is tested to simulate a stenosis • Simulations run for a single vessel omission, testing each element of the CoW • Verifies model against prior research using higher dimensional CFD methods • Simulation of a high risk stroke case with ICA blockage increasing resistance • Illustrates potential of this model
% drop in flow through RMCA after 20% pressure drop in RICA (Ferrandez, 2002) (Present Model) Balanced Configuration 18 19 Missing LPCA1 Not simulated 19 Missing LPCoA 18 19 Missing LACA1 18 20 Missing ACoA 18 20 Missing RACA1 20 21 Missing RPCoA 20 19 Missing RPCA1 Not simulated 19 Results – Omitted Artery Cases • No failure to return to qref flow • Return times ~15-25 seconds • Shows robustness of CoW system in maintaining flow and pressure
Balanced configuration before and after modelled stenosis Flowrates normalised to LICA Redshows change in direction from steady state Efferent Arteries
Missing ACoA case before and after modelled stenosis Before stenosis, same flowrates as balanced case Redshows change in direction from steady state Efferent flowrates maintained Efferent Arteries Note loss of communicating artery flow to support right side
Results – High Stroke Risk Case • High stroke risk case: • LICA and RICA radii reduced 50% and 40% respectively, representing potential carotid artery blockages • LPCA1 (Left Proximal Posterior Cerebral Artery) is omitted • 20mmHg pressure drop in RICA simulating a stenosis is simulated • This individual would be hypertensive to maintain steady state flow requirements – captured by model. • 93mmHg does not maintain reference flow rates in several efferent arteries, even at maximum dilation • ~113mmHg required to attain desired level. Case is not common in all individuals but is encountered in those needing an endarterectomy
Results – High Stroke Risk Case LEFT RIGHT LPCA fails to achieve desired flow rate, indicating a potential stroke risk under any procedure which entails such a pressure drop
Conclusions • A new, simple model of cerebral haemodynamics created • Model includes non-linear dynamics of auto-regulation • Iterative solution method developed enabling rapid diagnosis • Model verified against limited clinical data and prior research • Several simulations illustrate the robustness of the CoW • High stroke risk case illustrates the potential for simulating patient specific geometry and situation to determine risk Future work includes more physiologically accurate auto-regulation and geometry modelling, more clinical verification using existing data, and modelling of greater variety of potential structures
Punishment of the Innocent Questions ???