Download

1 / 43
440 likes | 735 Vues
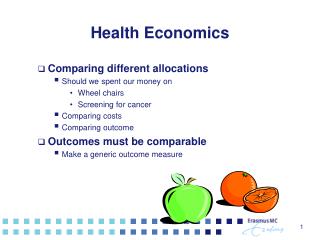
Economics 330 Economics of Health Care. Dr. Greg Delemeester Spring 2010. National Health Care Expenditures. Source: http://www.cms.hhs.gov/NationalHealthExpendData/. Why do Americans spend so much on medical care?. Aaron (1991) Expansion of 3 rd party payment system

E N D
Economics 330Economics of Health Care Dr. Greg Delemeester Spring 2010
National Health Care Expenditures Source: http://www.cms.hhs.gov/NationalHealthExpendData/
Why do Americans spend so much on medical care? • Aaron (1991) • Expansion of 3rd party payment system • Aging of the population • Expanded medical malpractice litigation • Increased use of medical technology • Other factors • Physician-induced demand • Entry restrictions • Predominance of not-for-profit providers
Personal Health Care Expenditures(in billions of dollars) Source: http://www.cms.hhs.gov/NationalHealthExpendData/
2008 National Health Care Dollar… …Where it Went …Where it Came From
Changes in Medical Care Delivery • Shift from private to public financing • Shift to 3rd party financing • Changes in hospital usage and pricing • Deregulation and growth in managed care
Payment Structure • Traditional fee structure • Fee for service • Retrospective payment • Incentive to overspend • Managed care • Capitation and risk sharing • Prospective payment • Incentive to limit care
Health Care As a Commodity • Demand is irregular • Asymmetric information problems • Widespread uncertainty • Reliance on not-for-profit providers • Insurance as the primary means of payment
Health System Goals • Access to care • Who’s covered? • What’s covered? • Quality of care • Cost of care
Private Health Insurance Coverage (under age 65, numbered in millions) * Employer-based. Source: Health, United States, 2008, http://www.cdc.gov/nchs/hus/updatedtables.htm, Table 138 and 140.
Health System Goals Access to care Who’s covered? What’s covered? Quality of care Medical outcomes Medical efficacy Cost of care Who pays? How much?
Economic Fundamentals • Optimization • Marginal Analysis • Supply and Demand • Equilibrium
What are the likely consequences of the following events in the U.S market for cosmetic surgery? • Health insurance coverage is expanded to cover all elective procedures, such as tummy tucks, nose jobs, and liposuction • The FDA (Food and Drug Administration) takes all silicone-based implants off the market fearing a connection with certain connective-tissue diseases • Personal finance companies start a nationwide lending program for cosmetic procedures not covered by health insurance • Medical malpractice insurance premiums increase for plastic surgeons • Medical schools announce that residents in plastic surgery can be licensed after only five years instead of the current seven years
Economic Fundamentals • Optimization • Marginal Analysis • Supply and Demand • Equilibrium • Elasticity • Welfare analysis • Effects of government intervention
Suppose the market for lasik eye surgery can be described by the following equations: Qd = 5100 – 6P Qs = - 400 + 5P • Solve for the market equilibrium price and quantity. • Calculate consumer and producer surplus. • Calculate the elasticity of demand at the equilibrium. • Suppose the government imposes an excise tax of $100 per surgery on eye surgeons. What is the new equilibrium price and quantity? What happens to social welfare?
Competitive Market Model • Many buyers/sellers • Homogeneous product • No entry barriers • Perfect information $ MC ATC Profit max rule: P = MC AVC P1 MR1 LR Equil: π = 0 q1 quantity
Market Failures • Market Power • Monopoly • Restricted entry (AMA, CON) • EOS • Monopsony • Externalities • Communicable diseases/immunizations • Uninsured and cost shifting • Public goods • Free-riders • R&D
Imperfections in Medical Markets • Imperfect/Asymmetric information • Agency problem (induced demand) • Adverse selection • Moral hazard • Third-party payers Hospitals: 3¢ per $1 Physicians: 20¢ per $1
Dealing with Market Failure • Collective provision • Medicare • Medicaid • Government regulation • Price controls • Entry restrictions • FDA • Tax Policy • Tax exemptions Government Failure?
The Inevitability of Trade-Offs • The value of a medical intervention • The inclusion of a drug on the formulary • Paying for an experimental procedure • Investing in new technology • Is it worth it? How do we measure value to insure we get value for spending?
Options for colorectal cancer screening • Fecal blood test ($20) • Sigmoidoscopy ($150 - $300) • Barium enema ($250 - $500) • Virtual Colonoscopy ($500 - $900) • Colonoscopy ($800 - $1200) Is it worth the extra money?
Types of Economic Evaluation • Cost of illness studies • Cost-benefit analyses • Cost-effectiveness studies
Cost of Illness Studies • What does it cost? • Burden of 5 chronic conditions in US (Druss et al., 2001) • Mood disorders, diabetes, heart disease, asthma, and hypertension • Direct cost of treatment: $62 billion • Cost of treating coexisting conditions: $208 billion • Lost productivity: $36 billion • Role in analysis – increased awareness $306 billion
Cost-Benefit Analysis • Net PV = Benefits today time Costs The higher the discount rate, r, the lower the PV
Cost-Benefit Criterion • If net benefit stream is positive, project is acceptable • If ratio is greater than one, project is acceptable • Examples • Clarke (1998): mobile mammographic screening and travel cost method • Ginsberg and Lev (1997): riluzole and ALS
Challenges of Cost-Benefit Analysis • Valuing benefits • How do you place a value on a human life? • Willingness-to-pay approach • wealth • life expectancy • current health status • possibility of substituting current consumption for future consumption • Choosing a discount rate
Cost-Effectiveness Analysis • Measures health benefit by health outcome, not the dollar value of life • Using the decision makers’ approach • Maximize the level of health for a given population subject to a budget constraint • Practical guide for choosing between programs or treatment options when budgets are limited
Cervical Cancer Screening The medical evidence is clear: Cervical cancer screening saves lives. Much of the focus of cost-effectiveness research addresses issues concerning the appropriate screening interval. D.M. Eddy (Screening for cervical cancer, Annals of Internal Medicine 113, 214-226, 1990) studied the issue and estimated that annual screening for a hypothetical cohort of 1,000 22-year-old women screened until age 75 would cost $1,093,000 and would save 27.6 life years. If screened every three years instead, the cost would be $467,000 and 26.8 life years would be saved. Is annual screening cost effective?
Incremental Cost-Effectiveness Ratio • If CA > CB and EA < EB, B dominates. • If CA < CB and EA > EB, A dominates. • If, however, CB > CA and EB > EA, choice is not obvious. Use CE.
ICER Curve: 2 Treatments Effectiveness Large ICER = flat slope B EB A EA Cost CA CB
Cervical Cancer Screening: Redux • D.M. Eddy (Screening for cervical cancer, Annals of Internal Medicine 113, 214-226, 1990) studied the issue and estimated that annual screening for a hypothetical cohort of 1,000 22-year-old women screened until age 75 would cost $1,093,000 and would save 27.6 life years. If screened every three years instead, the cost would be $467,000 and 26.8 life years would be saved. • What is the ICER?
ICER Curve: Multiple Treatments Effectiveness “flat of the curve” G F D E B C A Treatments C and E are dominated Cost
Measuring Costs • Direct – associated with use of resources • Medical • Non-medical • Indirect – related to lost productivity • Intangible – associated with pain and suffering, grief, anxiety, and disfigurement
Measuring Effectiveness Improvements in Health • Surrogate measures stated in terms of clinical efficacy • Blood pressure, cholesterol levels, bone mass density, or tumor size • Intermediate measures stated in terms of clinical effectiveness • Events (heart attack, stroke, cancer), scores on exams • Final outcomes measure economic effectiveness • Events avoided, disease-free days, life-years saved, quality-adjusted life years saved
Problem Set 1: #16 Survival Measures Improved Life Expectancy Due to Clinical Treatment Life expectancy = area under survival function Survival probability LE w/o treatment = ½(1.00-0.0)6.5 = 3.25 yrs A 100% Gain in LE during trial = ½(.90-.77)1.5 = 0.0975 yrs Gain in LE after trial = ½(.90-.77)5 = 0.325 yrs B 90% Total Gain in LE = 0.4225 yrs 77% C Survival function for treatment group Survival function for control group D Time (years) 1.5 6.5
Quality of Life Measures: QALY • Quality-Adjusted Life Year • Measured on a preference scale anchored by death (0) and perfect health (1)
Calculating a QALY Utility Normal 55-yr old male has LE of 25 more yrs Diabetic 55-yr old male has LE of 15 more yrs U(H1) x = healthy years t = chronic health years U(HD) 6 15 Time (years) Value of one year in chronic health state is x/t Utility value of 15 years = 6/15 = 0.40 QALY of remaining 15 years = (.40)(15) = 6 years
Handout Decision Trees