Download
1 / 4
40 likes | 151 Vues
This study investigates the binding of various anti-human TM4SF1 mouse monoclonal antibodies to human umbilical vein endothelial cells (HUVEC) using flow cytometry. Suspended HUVEC were incubated with purified anti-TM4SF1 antibodies and analyzed for binding affinity. The results indicate that specific clones, such as 8G4, demonstrate significant interaction with HUVEC, unlike the control IgG. The research provides insights into the potential applications of these antibodies in targeting TM4SF1 in therapeutic contexts.

E N D
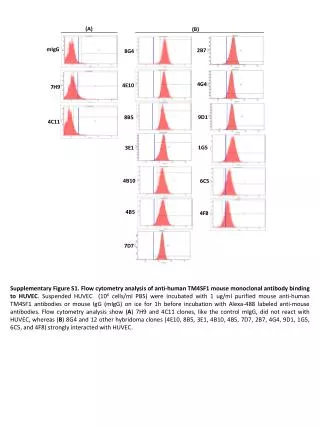
(A) (B) mIgG 2B7 8G4 4G4 4E10 7H9 9D1 8B5 4C11 1G5 3E1 4B10 6C5 4B5 4F8 7D7 Supplementary Figure S1. Flow cytometry analysis of anti-human TM4SF1 mouse monoclonal antibody binding to HUVEC. Suspended HUVEC (106 cells/ml PBS) were incubated with 1 ug/ml purified mouse anti-human TM4SF1 antibodies or mouse IgG (mIgG) on ice for 1h before incubation with Alexa-488 labeled anti-mouse antibodies. Flow cytometry analysis show (A) 7H9 and 4C11 clones, like the control mIgG, did not react with HUVEC, whereas (B) 8G4 and 12 other hybridoma clones (4E10, 8B5, 3E1, 4B10, 4B5, 7D7, 2B7, 4G4, 9D1, 1G5, 6C5, and 4F8) strongly interacted with HUVEC.
(A) TM4SF1 wild type, mutant, and mouse-human TM4SF1 chimeric constructs EL1 EL2 IL N C TM4SF1 constructs TM1 TM2 TM3 TM4 n n l 46 l 89 l 163 l 10 l 202 HEMn (8G4 / Phalloidin/ DAPI) (B) (i) Control (ii) FL (iii) EL1 FL Wild Type 202 1 n n EL1 94 1 EL2 202 67 n n Mutants 10 μm 10 μm 10 μm DraIII (iv) EL2 (v) n129/159 N129/159G g g 1 202 g g Human Mu-Hu TM4SF1 Chimera 1 202 N N Mouse Mouse 10 μm 10 μm Supplementary Figure S2. Hybridoma screening and epitope mapping strategies for characterizing anti-human TM4SF1 mouse monoclonal antibodies. (A) Various human TM4SF1 constructs: FL, full length; EL, extracellular loop; IL, intracellular loop; TM, transmembrane; N, N-terminus; C, C-terminus. EL1, mutant expressing amino acids 1-94 that starts from N-terminus and end at the beginning of TM2. EL2, mutant expressing amino acids 67-202 that starts at the beginning of IL and includes TM3 and TM4 and end at C-terminus. N129/159G, mutant in which the two potential N-glycosylation sites (asparagines 129 and 159) were mutated to glycine (two separate PCR fragments were prepared, cut with DraIII restriction enzyme, and then ligated with T4 DNA ligase). Mu-Hu TM4SF1, murine-human chimera in which full length mouse TM4SF1 EL2 (amino acids 117 to 164) was replaced by human TM4SF1 EL2, that was chemically synthesized. Domain information was obtained from the Human Protein Reference Database. (B) All constructs were transduced at ~500 mRNA copies/cell into TM4SF1-null HEMn(Human Epidermal Melanocytes, neonatal). Cells were fixed in 4% PFA and screened with monoclonal antibodies by immunocytochemistry. Representative experiment showing 8G4 and phalloidin staining of HEMn transduced with (i) empty vector, (ii) FL-TM4SF1, (iii) EL1, (iv) EL2, or (v) N129/159G. Staining was lost when (iii) EL2 was absent or (v) when both N-glycosylated regions were mutated.
Ligand Supplementary Figure S3. ECFC integrin expression profile. Forty-eight hour pre-culture of passage 4 ECFC on CG- or CG/FN/LN-coated plates had no significant effect on RNA expression levels of human integrin superfamily members. Family members reactive with fibronectin (FN, blue font), collagen I (CG, pink font), and laminin(LN, green font) are indicated.
(B) (A) ECFC (RFP)/ MSC (GFP) 48h co-culture on glass disc 10 μm Supplementary Figure S4. ECFC and MSC interactions in culture. Passage-3 ECFC and MSC were respectively transduced with 25 moi adenovirus-RFP or -GFP for 24h to express RFP or GFP, and were harvested for (A) co-culturing, or (B) total RNA extraction for gene expression profiling. (A) A representative 48h immunofluorescent image shows close contact and interactions between ECFC and MSC cells. (B) ECFC express high levels of VEGFR1, VEGFR2 and PDGF-β while their ligand or receptor partners VEGF-A and PDGFRβ are highly expressed by MSC.