Download

1 / 61
620 likes | 774 Vues
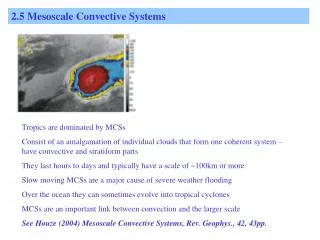
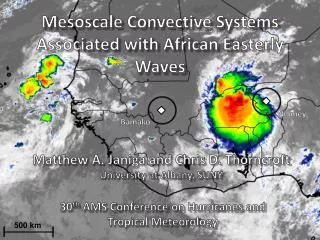
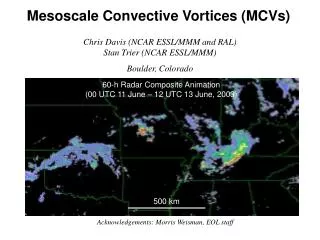
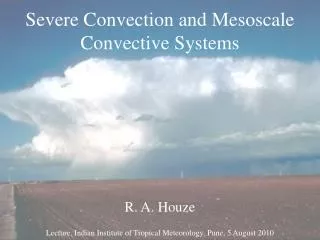
Mesoscale Convective Systems Associated with African Easterly Waves. Niamey. Bamako. 30 th AMS Conference on Hurricanes and Tropical Meteorology. Matthew A. Janiga and Chris D. Thorncroft University at Albany, SUNY. 500 km. What do we know about the AEW-MCS Relationship?. 12.5°-20°N.

E N D
Mesoscale Convective Systems Associated with African Easterly Waves Niamey Bamako 30th AMS Conference on Hurricanes and Tropical Meteorology Matthew A. Janiga and Chris D. Thorncroft University at Albany, SUNY 500 km
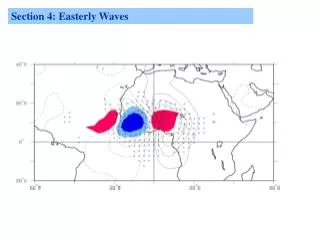
What do we know about the AEW-MCS Relationship? 12.5°-20°N Squall Line Generation • Fink and Reiner (2003) found that squall line generation primarily occurred NW of the mid-level AEW vortex and south of the northern AEW low-level vortex. • Dissipation occurred in the ridge. NE Latitude NW 5°-12.5°N Mid-level Vortex Longitude Adapted from Fink and Reiner (2003)
What is responsible for this relationship? Based on Berry and Thorncroft (2005) and others • The NW squall line initiation maximum is related to a westerly low-level jet (LLJ) with high equivalent potential temperature (θe) (Berry and Thorncroft, 2005). • The westerly LLJ is associated with the northern low-level vortex. SHL – Saharan heat low LLJ – Low-level jet ITD – Intertropical discontinuity AEJ – Africa easterly jet (at 600 hPa) X – Vorticity maximum or trough
What is still not understood? • How AEW Structure Supports Convective Development… • The vertical distribution of moisture and temperature. • This is important for forecasting convective systems associated with AEWs. b) Properties of Precipitation Features (PFs) in the AEW envelope… • The size, intensity, and vertical development of the PFs. • The vertical structure of convective and stratiform regions. • The vertical structure of convection affects the heating profiles and the upscale impact of convection on the AEWs.
Data TRMM 3B42 is a continuous gridded rain rate dataset (Huffman et al., 2007) utilizing passive microwave, precipitation radar (PR), geostationary infrared (IR), and rain gauge data. Wavenumber-frequency filtered TRMM 3B42 is used to determine AEW phase and amplitude. The NCEP Climate Forecast System Reanalysis (CFSR) (Saha et al., 2010) is one of the latest-generation reanalyses. Analyses are composited by AEW phase to diagnose the thermodynamic and kinematic AEW structure. TRMM PR and TMI orbital swaths contain information on the vertical structure of convection and PF properties. Orbital data is binned by AEW phase using 3B42 rain rate filtered for synoptic westward propagating convection.
Determining Maximum and Minimum Phases of TD Filtered 3B42 Composite Domain Maximum Minimum Standard Deviation of TD filtered 3B42 RR TD Filter Period: 2.5-10 days Wavenumbers: -20 to -7 (2000-5600 km) Domain: 5-12.5°N, 10°W-20°E 3B42 (shaded, mm hr-1) and TD filtered 3B42 RR (every 1.5σ).
Determining Increasing and Decreasing Phases of TD Filtered 3B42 Composite Domain Increasing Decreasing Standard Deviation of TD filtered 3B42 dRR/dt TD Filter Period: 2.5-10 days Wavenumbers: -20 to -7 (2000-5600 km) Domain: 5-12.5°N, 10°W-20°E 3B42 (shaded, mm hr-1) and TD filtered 3B42 dRR/dt(every 1.5σ).
AEW Phase Partitioning using Wavenumber-Frequency Filtered 3B42 TRMM Orbital Binning Schematic INC 1.5σ INC TOO WEAK MAX MIN 3B42 TD dRR/dt (standard deviations) MIN Maximum DEC DEC Minimum MAX 3B42 TD RR (standard deviations) 8 AEW phases are identified using the 3B42 TD filtered RR and dRR/dt. The AEW phase and amplitude is used to partition orbital data binned to the same 1.0°x1.0° grid. AEW Phases for > 1.5σ Amplitude (shaded) and TD Filtered 3B42 RR (every 1.5σ).
AEW Structure Phase 1 is located ahead of the trough. The cold-core AEWs have troughs and ridges which peak between 600-700 hPa. There is a quadrapole of temperature anomalies. This is because the temperature gradient reverses above 700 hPa. Ridge Trough
Moisture and Thermodynamics There is increased moisture ahead of the and within the AEW trough. Within and ahead of the ridge is dry. High low-level θe (and CAPE) is found ahead of the trough with lower low-level θe in the southerlies. Moist Dry Low CAPE High CAPE
Shear The AEJ strengthens ahead of the trough and weakens behind it. Surface westerlies are enhanced ahead of the trough. Both of these act to increase the shear ahead of the trough and weaken it behind the trough. Reduced Shear Enhanced Shear
Variation of Rainfall and Stratiform Ratios by Wave Phase The TD waves show a clear transition from convective to stratiform rainfall between the leading and trailing edges of the convective envelope. Does the structure of the convective and stratiform precipitation vary too? Wave Phase (Dynamics - CFSR) RIDGE N TROUGH S RIDGE Wave Phase (Precipitation – 3B42) Black solid = Total rain rate Blue solid = Stratiform rain rate Red solid = Convective rain rate Black dashed = Stratiform fraction
Wave-Phase CFADs (Convective) • Two convective modes are apparent over this region. • A deep mode where convection reaches the tropopause. • A shallow mode where most of what is observed is below the melting level. Deep Mode Shallow Mode The % of reflectivity values falling in each bin at each level. Composite of all 8 phases for convective precipitation. Domain: 5-12.5°N, 10°W-20°E.
Wave-Phase CFADs (Convective) Comp. 7:INC 8 Shows a composite CFAD for all phases and the differences between each phase. CFADs are normalized for each phase. The main difference is a tendency towards increased shallow-warm rain in the suppressed phase and deep convection in the enhanced phase. 3: DEC 2 1: MAX 4 6 5: MIN
Wave-Phase CFADs (Stratiform) • The stratiform regions have lower reflectivity values than the convective regions. The reflectivity also doesn’t extend as high. • A kink toward high reflectivity values is found between 4-5 km associated with the bright band / melting level. Bright Band / Melting Level The % of reflectivity values falling in each bin at each level. Composite of all 8 phases for stratiform precipitation. Domain: 5-12.5°N, 10°W-20°E.
Wave-Phase CFADs (Stratiform) Comp. 7:INC 8 The main difference is a tendency towards increased reflectivity in the enhanced phase and reduced reflectivity in the suppressed phase. The enhanced phases have a deeper column of observable reflectivity above the melting level. 3: DEC 2 1: MAX 4 6 5: MIN
Modification of the Diurnal Cycle The enhanced phase has the “flattest” diurnal cycle with the largest fractional contributions from early morning (0000-0600 LT) rainfall. In the suppressed phase, the greatest percentage occurs at 1800 LT. There is very little contribution from the diurnal minimum (0600-1200 LT). Climatology Enhanced (Phase 1) Suppressed (Phase 5) The % of the diurnal cycle’s rainfall coming from each 3-hr block (local time) for Phase 1, Phase 5, and the domain climatology. Domain: 5-12.5°N, 10°W-20°E
Identification of Precip. Features (PFs) • Precipitation features (PFs) are defined as contiguous regions of rain rate > 0 mm hr-1from the TRMM PR (no size criteria are applied). • 3 PF characteristics are defined using the rain rate, reflectivity profiles, and collocated TMI data. • PF Size • 18 dBZ echo top • Minimum 85 gHZtemperature • We focus on the total rainfall from PFs at falling in each PF characteristic value bin.
Enhanced (Phase 1) 85 GHz PCT Suppressed (Phase 5) Climatology • Compared to the suppressed phase, the enhanced phase has a larger contribution of its rainfall from PFs with • higher echo tops • larger PFs • colder minimum 85 GHz temps. Object Size The % of the rainfall coming from a range of PF characteristic bins for Phase 1, Phase 5, and the domain climatology. Domain: 5-12.5°N, 10°W-20°E
Summary of the AEW-Convection Relationship • AEWs increase the vertical extent, size, and rainfall intensity of convective systems. • The enhanced (suppressed) phases particularly enhance (suppress) rainfall early in the day (0000-0900 LT). • Shear, instability, lift, and moisture are all increased in the northerlies.
Volumetric Rain Contribution: System Size 10000 The “50/50 split” of the volumetric rain bins at each 1.0°x1.0° grid box. The regions with high rain rates are dominated by contributions from large PFs while the cold tongue and Egypt are dominated by very small systems.
Volumetric Rain Contribution: Echo Tops • Add 85 gHZ PCT • There is an axis of intense convection stretching from Sudan westwards toward Senegal. • A second region of intense convection is found on the slopes where the Great Escarpment meets the Congo Basin.
Life-Cycle of the Niamey MCS Sep. 7, 1200Z 2006 • IR (shaded) and 700 hPa Streamfunction • (x106 m2s-1, contours) Triggering occurs near the Jos Plateau ahead of the AEW trough.
Life-Cycle of the Niamey MCS Sep. 7, 1800Z 2006 • IR (shaded) and 700 hPa Streamfunction • (x106 m2s-1, contours) In the late afternoon convection expands in coverage.
Life-Cycle of the Niamey MCS Sep. 8, 0000Z 2006 • IR (shaded) and 700 hPa Streamfunction • (x106 m2s-1, contours) Most of the other convection weakens but the Niamey MCS strengthens as the nocturnal LLJ develops.
Life-Cycle of the Niamey MCS Sep. 8, 0600Z 2006 • IR (shaded) and 700 hPa Streamfunction • (x106 m2s-1, contours) More intensification occurs through 0600Z when the LLJ reaches its peak intensity.
Life-Cycle of the Niamey MCS Sep. 8, 1200Z 2006 • IR (shaded) and 700 hPa Streamfunction • (x106 m2s-1, contours) As the LLJ weakens at 1200Z the MCS begins to dissipate.
925 hPa θv (K, shaded), streamfunction (x106 m2s-1, contours), winds (ms-1, vectors), and vorticity (> 2.5x10⁻⁵ s-1, pattern). NV MCS Sep. 8, 0600Z 2006 • 925 hPa θe (K, shaded), streamfunction (x106 m2s-1, contours), winds (ms-1, vectors), and vorticity (> 2.5x10⁻⁵ s-1, pattern). NV MCS
Niamey Radar 150 km
Niamey Radar 150 km
Niamey Radar 150 km
Niamey Radar 150 km
Niamey Radar 150 km
Niamey Radar 150 km
Niamey Radar 150 km
Niamey Radar 150 km
Niamey Radar 150 km
Life-Cycle of the Bamako MCS Sep. 9, 1800Z 2006 • IR (shaded) and 700 hPa Streamfunction • (x106 m2s-1, contours) Triggering occurs in the late afternoon.
Life-Cycle of the Bamako MCS Sep. 10, 0000Z 2006 • IR (shaded) and 700 hPa Streamfunction • (x106 m2s-1, contours) Intensification occurs as the LLJ begins to develop.
Life-Cycle of the Bamako MCS Sep. 10, 0600Z 2006 • IR (shaded) and 700 hPa Streamfunction • (x106 m2s-1, contours) Continued intensification occurs up through 0600Z when the LLJ reaches its peak intensity.
Life-Cycle of the Bamako MCS Sep. 10, 1200Z 2006 • IR (shaded) and 700 hPa Streamfunction • (x106 m2s-1, contours) The MCS begins to weaken at 1200Z as the LLJ begins to weaken.
925 hPa θv (K, shaded), streamfunction (x106 m2s-1, contours), winds (ms-1, vectors), and vorticity (> 2.5x10⁻⁵ s-1, pattern). NV MCS Sep. 10, 0600Z 2006 • 925 hPa θe (K, shaded), streamfunction (x106 m2s-1, contours), winds (ms-1, vectors), and vorticity (> 2.5x10⁻⁵ s-1, pattern). NV MCS
Bamako Radar 150 km
Bamako Radar 150 km
Bamako Radar 150 km
Bamako Radar 150 km