DYNAMIC PLANET
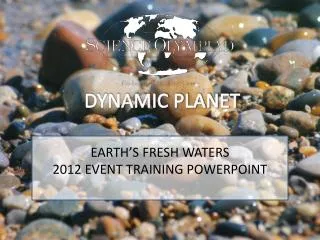
DYNAMIC PLANET. EARTH’S FRESH WATERS 2012 EVENT TRAINING POWERPOINT. Presented by:. MARK A. VAN HECKE NATIONAL SCIENCE OLYMPIAD EARTH-SPACE SCIENCE EVENTS CHAIR/EVENT TRAINER SENIOR SOCIAL STUDIES INSTRUCTOR INSTRUCTIONAL DESIGN/TECHNOLOGY CONSULTANT ANCHOR BAY HIGH SCHOOL

DYNAMIC PLANET
E N D
Presentation Transcript
DYNAMIC PLANET EARTH’S FRESH WATERS 2012 EVENT TRAINING POWERPOINT
Presented by: MARK A. VAN HECKE NATIONAL SCIENCE OLYMPIAD EARTH-SPACE SCIENCE EVENTS CHAIR/EVENT TRAINER SENIOR SOCIAL STUDIES INSTRUCTOR INSTRUCTIONAL DESIGN/TECHNOLOGY CONSULTANT ANCHOR BAY HIGH SCHOOL FAIR HAVEN, MICHIGAN mvanhecke@comcast.net
Presentation OBJECTIVES Discuss rule changes and event parameters for the 2012 Dynamic Planet Event Demonstrate instructional strategies that may be used to create an event training program for event trainers and students Identify resources that may be used to help prepare students for the 2012 Dynamic Planet Event
EVENT DESCRIPTION The theme of the 2012 Dynamic Planet competition will be Earth’s fresh waters.
EVENT DESCRIPTION Earth’s Fresh Waters is one of four rotating, two-year events of the Dynamic Planet event. 2011-2012: Earth’s Fresh Waters 2013-2014: Glaciers 2015-2016: Oceanography 2017-2018: Earthquakes & Volcanoes
WHAT STUDENTS WILL DO Students will be presented with one or more tasks requiring the use of science process skills to complete tasks related to the study of Earth’s fresh waters including: • Identification and interpretation of stream geology features of USGS topographic maps • Construct a simple water table contour map and use it to indicate the direction of groundwater movement
ACTIVITY 1 IDENTIFYING FRESH WATER GEOLOGY FEATURES ON USGS TOPOGRAPHIC MAPS In this activity, you will: • Use USGS Topographic Maps to locate and identify freshwater geology features including valley shapes, drainage patterns, erosional and depositional features Materials Needed: • USGS Topographic Map • USGS Topographic Map Key
IDENTIFYING FRESH WATER GEOLOGY FEATURES ON USGS TOPOGRAPHIC MAPS Orient your USGS topographic map so that the USGS logo is in the upper left corner.
IDENTIFYING FRESH WATER GEOLOGY FEATURES ON USGS TOPOGRAPHIC MAPS The borders of the Quadrangle are bounded by four neat lines-right, left, bottom, and top Top Neat Line Left Neat Line Right Neat Line Margin Quadrangle Bottom Neat Line
IDENTIFYING FRESH WATER GEOLOGY FEATURES ON USGS TOPOGRAPHIC MAPS The borders of the Quadrangle are bounded by four neat lines-right, left, bottom, and top Top Neat Line Left Neat Line Right Neat Line Margin Quadrangle Bottom Neat Line
IDENTIFYING FRESH WATER GEOLOGY FEATURES ON USGS TOPOGRAPHIC MAPS Place your finger on the bottom right corner of the quadrangle where the bottom and right neat lines meet
IDENTIFYING FRESH WATER GEOLOGY FEATURES ON USGS TOPOGRAPHIC MAPS Now move your finger up along the right neat line until you reach a minute measurement (32’30” on the Isabella, MO topographic map) On the Big Goat Mountain, WA Map that measurement will be 2’30”
IDENTIFYING FRESH WATER GEOLOGY FEATURES ON USGS TOPOGRAPHIC MAPS Now move your finger left in a straight line across the quadrangle until you see the same minute measurement (32’30” on the Isabella Quadrangle) on the left neat line. 2’30” on the Big Goat Mountain Quadrangle
IDENTIFYING FRESH WATER GEOLOGY FEATURES ON USGS TOPOGRAPHIC MAPS Note the two crosshairs in the bottom third of the quadrangle as you moved across the map.
IDENTIFYING FRESH WATER GEOLOGY FEATURES ON USGS TOPOGRAPHIC MAPS Return to the 32’30” measurement on the right neatline. Move your finger upwards towards the next minute measurement which on the Isabella Quadrangle is 35’ On the Big Goat Mountain Quadrangle, that will be 5’
IDENTIFYING FRESH WATER GEOLOGY FEATURES ON USGS TOPOGRAPHIC MAPS Now move your finger left in a straight line across the quadrangle until you see the same minute measurement (35’) on the left neat line. 5’ on the Big Goat Mountain Quadrangle
IDENTIFYING FRESH WATER GEOLOGY FEATURES ON USGS TOPOGRAPHIC MAPS Note the two crosshairs in the upper third of the quadrangle as you moved across the map.
IDENTIFYING FRESH WATER GEOLOGY FEATURES ON USGS TOPOGRAPHIC MAPS You can now use these four sets of crosshairs to separate the quadrangle into nine ‘mental sectors’ that can be used to identify the location of features on the map.
IDENTIFYING FRESH WATER GEOLOGY FEATURES ON USGS TOPOGRAPHIC MAPS Note the location of Wilkinson Knob in Sector 1 of the Isabella Quadrangle Look for Graham Harbor Creek Campground in Sector 1 of the Big Goat Mountain Quadrangle
IDENTIFYING FRESH WATER GEOLOGY FEATURES ON USGS TOPOGRAPHIC MAPS Note the location of the town of Locust in Sector 6 of the Isabella Quadrangle Find the Safety Harbor Campground in Sector 6 of the Big Goat Mountain Quadrangle
IDENTIFYING FRESH WATER GEOLOGY FEATURES ON USGS TOPOGRAPHIC MAPS In what Sector is Pontiac, Missouri found in the Isabella Quadrangle? 7 In what Sector is Deep Harbor found in the Big Goat Mountain Quadrangle? 4
IDENTIFYING FRESH WATER GEOLOGY FEATURES ON USGS TOPOGRAPHIC MAPS In what Sector is the village of Isabella found in the Isabella Quadrangle? 4 In what Sector is Corral Creek campground found in the Big Goat Mountain Quadrangle? 5
IDENTIFYING FRESH WATER GEOLOGY FEATURES ON USGS TOPOGRAPHIC MAPS Here’s an example of a question written using mental sector as a determinant in a feature’s location: What type of river, lake or canal is Big Spring Hollow located in Sector 9? Perennial Stream
IDENTIFYING FRESH WATER GEOLOGY FEATURES ON USGS TOPOGRAPHIC MAPS On large lakes and bodies of water, some of the information you will need is located on the watershed itself: What is the normal pool elevation of Bull Shoals Lake as indicated in Sector 7? 654’ (above sea level)
IDENTIFYING FRESH WATER GEOLOGY FEATURES ON USGS TOPOGRAPHIC MAPS Now complete the questions for Activity 1 on your own. Questions for both quadrangles are found on the Activity 1 sheet. Use your USGS Topographic Map Key to identify the features
Answers for Isabella, MO Quadrangle Sector 7 Woodland Perennial Lake/Pond West-Southwest Section Numbers (Township) Intermittent Lake/Pond 789’ Sector 7 Perennial stream Campground
Answers for Big Goat Mountain, WA Quadrangle Sector 3 Woodland Intermittent Streams North-Northeast Federally Administered Park Northeast Rock Bare/Awash Sector 9 Perennial stream 5, 450’
ELEMENTS OF A SUCCESSFUL TRAINING PROGRAM
TASK ANALYSIS First, identify the key event topics outlined in the Dynamic Planet event rules. Be sure that you have the current year rules.
TASK ANALYSIS Next, for each Key Event Topic, determine what a student must know or be able to do to successfully complete the event requirements
TASK ANALYSIS Next, Identify materials, work conditions and other resources needed by the student to learn about each key event topic
TASK ANALYSIS To complete your Task Analysis, establish minimum performance expectations for each of the Key Event Topics
ACTIVITY 2 Construct a Simple Groundwater Contour Map In this activity, you will: Construct a simple water table contour map and use it to indicate the direction of groundwater stream flow
Construct a Simple Groundwater Contour Map Groundwater usually flows in the same direction that land slopes, often towards a nearby lake or stream. By determining the slope or plane of the water table, we can estimate how groundwater will flow at a certain location
Construct a Simple Groundwater Contour Map STEP 1: Orient the activity sheet and note the location of the sample wells indicated by the example below The top number is the land elevation (above sea level). The bottom number is the depth to the water table Land Elevation Depth to Water Table
Construct a Simple Groundwater Contour Map STEP 2: Locate wells 316/16 and 378/18 in the upper center of the map. Subtract the depth to the water table from land elevation for both wells. This represents the Static Water Level (SWL) of the monitoring site. Write the SWL next to the well.
Construct a Simple Groundwater Contour Map STEP 3: Construct water table contour lines by doing the following for each adjacent pair of monitoring sites STEP 3-TASK 1 Draw a dashed line between the two adjacent wells.
Construct a Simple Groundwater Contour Map STEP 3-TASK 2 Subtract the smaller of the two SWLs from the larger. This is the difference in water table elevation (in feet) between the two wells. STEP 3-TASK 3 Calculate the number of subdivisions needed by dividing the difference in water table elevations by 10
Construct a Simple Groundwater Contour Map STEP 3-TASK 4 Calculate the distance between subdivisions by dividing the distance between the wells by the number of subdivisions needed STEP 3-TASK 5 Divide the line between the two wells into units representing 10’ (feet) intervals. Draw vertical lines to indicate the intervals
Construct a Simple Groundwater Contour Map STEP 4 Next, label each of the subdivision marks with the appropriate SWL as shown
Construct a Simple Groundwater Contour Map STEP 5 Repeat steps 1-4 for each pair of adjacent wells. Your map should look something similar to what appears on your Activity 2 Handout
Construct a Simple Groundwater Contour Map STEP 6 Overlay your map with tracing paper or a transparency Mark a small dot for each SWL measurement on the tracing paper or transparency. Connect equivalent SWLs with light pencil lines. These lines represent the contour of the water table elevation
Construct a Simple Groundwater Contour Map STEP 7 Polish up your contour lines by rounding the sharp corners. Your final drawing should look something like this.
REVIEW OF TASK ANALYSIS Identify the key event topic outlined in the Dynamic Planet event rules that you will focus your practice session on
REVIEW OF TASK ANALYSIS Determine what a student must know or be able to do to successfully complete the event requirements
REVIEW OF TASK ANALYSIS Identify resources needed by students to learn each key topic and acquire them
REVIEW OF TASK ANALYSIS Establish minimum performance expectations for each Key Event Topic