Download
1 / 37
370 likes | 556 Vues
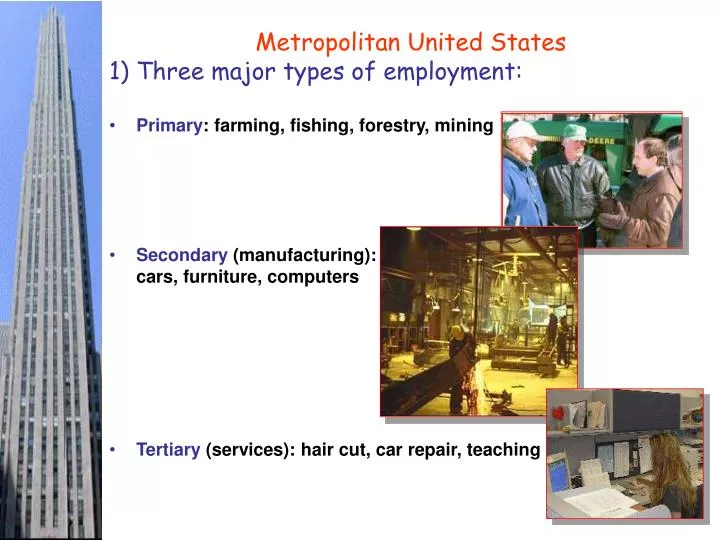
Metropolitan United States Three major types of employment: Primary : farming, fishing, forestry, mining Secondary (manufacturing): cars, furniture, computers Tertiary (services): hair cut, car repair, teaching. Metropolitan United States Changing Employment Sectors.

E N D
Metropolitan United States • Three major types of employment: • Primary: farming, fishing, forestry, mining • Secondary (manufacturing): • cars, furniture, computers • Tertiary (services): hair cut, car repair, teaching
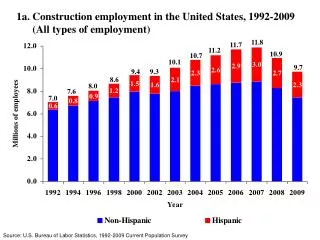
Metropolitan United States Changing Employment Sectors Three main types of service sector jobs today;1. transformational, involves physical activity, e.g., construction 2. transactional, routine work in call centers and banks 3. interactional, relying on knowledge, expertise, e.g., management 3.3 million USA jobs (500,000 of them in IT) will move abroad by 2015. In 1979-99, 69% of people who lost jobsas a result of cheap imports found new work. 55% of those who found new jobs did so at lower pay, and 25% took pay cuts of 30% or more. In 2005, 12,000 legal jobs moved off-shore; in 2010, 35,000. Every dollar of costs that companies move offshore brings them a net benefit of $1.12 to $1.14 (The Economist, 13 Dec. 2003)
Stage 1 Era Spatial pattern Characteristics national west east (initial settlement) • European settlers and African slaves • 1870-1919: net immigration 50% of US pop 1789-1890 Metropolitan United States 2) U.S. immigration and internal migration:
Chicago farms Metropolitan United States 2) U.S. immigration and internal migration:
inner city suburbs Metropolitan United States 2) U.S. immigration and internal migration:
Metropolitan United States 2) U.S. immigration and internal migration: 2000 Census: over 50% of U.S. pop. lived in suburban communities inner city suburbs edge cities Excel graph: metro population change 1990-2000
Old Immigration New Immigration Metropolitan United States European migrations: Old and New Immigrations Immigration Restriction Act of 1924 established annual quotas based on the national origin of people already in the U.S. The ceiling was set at 2 percent of the number of each U.S. origin group. But instead of using the 1920 Census, Congress used the 1890 Census, which favored Western European over Eastern and Southern Europeans. Instead of allowing 4 million Italians, 2 million Eastern Europeans (including Jews), and 1.5 million Roman Catholics, the 1924 law allowed 34,007 immigrants from Great Britain, but fewer than 4,000 Italians, barely 2,000 Russians, and less than 500 Hungarians! People with money can now buy USA visas through the Immigrant Investor Programme and the proposed Visit USA Act -- $500,000 will usually do the trick.
Old Immigration New Immigration Metropolitan United States European migrations: Old and New Immigrations 33 % of U.S. physics Nobel price winners in last seven years were born abroad. 40 % of science & engineering PhDs working in the USA are immigrants. 33 % of Silicon Valley companies were started by Indians and Chinese. 100,000s of legal and illegal immigrants work in agriculture, construction, hotels, restaurants, gardens, and health care. 19th century European immigrants could expect to double their income. Today, immigrants can expect to see their incomes rise 5 fold or more! 1924 Immigration Act
Metropolitan United States 3) City building era
Metropolitan United States Why are cities large and small? Why are cities close and far apart?
Metropolitan United States • 4) City functions: • provide services to surrounding farmers and rural people • facilitate interaction, circulation of people, goods, capital • collect, process, and distribute • cities specialize: resource-based, manufacturing, services • 5) Urban patterns: size and spacing of cities • (service functions) • Central Place Theory by Walter Christaller • Two basic concepts: • a) Threshold: minimum market (price x quantity) needed to bring a firm or city selling goods and services into existence and to keep it going • b) Range: average maximum distance people will travel to purchase goods and services from a firm or city • • Low-order goods and services: e.g., milk and bread; short distances • • High-order goods and services: e.g., cars and mink coats; long distances
Metropolitan United States Spatial consequences of these two concepts Draw circles around the point for threshold and range. threshold range
Metropolitan United States Insufficient threshold -- what happens? no cities; no economic activities? Many examples of insufficient thresholds: past and present and poor and rich countries.
Metropolitan United States Threshold and range vary for each good and service in each technological era. • If population density and purchasing power are evenly distributedacross space, the firms and central places (cities) will spring up evenly spaced • Ranges as circles: overlap or incomplete coverage
Metropolitan United States What shape covers all of an area without overlap?
Metropolitan United States Hierarchy of central places are nested within ever larger hexagons 2 3 4
Metropolitan United States Hierarchy of central places and services few many services places 2 3 many few Many low order places; few high order places Few low order services; many high order services 4
Metropolitan United States • 6) Three principles affect the spatial arrangement of cities: • Market principle: evenly spaced cities (already discussed above) • Transportation principle: cities located along routes (water, road, rail)
Metropolitan United States 3) Political principle: laws prevent or allow services:casino gambling, state lotteries, alcohol consumption – e.g., I80 in Utah to Nevada The top 6 lottery stores in Missouri and Oklahoma are located near the Arkansas line because Arkansas does not have a state lottery. Oklahoma alone makes about $10 million a year from Arkansas residents. The border city of Bangkang in Myanmar has casinos for Chinese tourists who are banned from legally gambling in China.
Metropolitan United States 7) Size of cities or urban hierarchy Seven basic levels or orders of central places National metropolises -- New York City (world city)go to http://www.census.gov/dataviz/visualizations/036/ 2) Regional metropolises -- Chicago 3) Metropolitan centers -- Minneapolis-St. Paul 4) Cities -- sporting goods store, hospital, dentist, regional high school 5) Towns -- department and jewelry store, family doctor 6) Villages -- elementary school, car dealer 7) Hamlets -- tavern, gas station, church, grocery store Top 10 USA business destinations: Atlanta, Boston, Chicago, Dallas, Denver, Los Angeles, New York, Orlando, San Francisco, Washington, DC World’s busiest airports: Atlanta, Chicago, (London, Tokyo), Los Angeles, Dallas/Ft, Worth, (Frankfurt, Paris, Amsterdam), Denver
Metropolitan United States Examples of High Order Cities & Regions
Metropolitan United States Examples of High Order Cities & Regions
Metropolitan United States Examples of High Order Cities & Regions
1999 1997 2000 Metropolitan United States Examples of High Order Cities & Regions POP = internet infrastructure
Wal-Mart supercenters provide low-order urban functions and so the distribution of these centers is evenly (relative to population densities) and widely scattered.
Age-Group Net Migration among U.S. City Sizes Urban hierarchy David Plan and Jason R. Jurjevich, “Ties that no longer bind? The Patterns and Repercussions of Age-Articulated Migration,” The Professional Geographer, 61 (1), 4-20.
Age-Group Net Migration among U.S. City Sizes David Plan and Jason R. Jurjevich, “Ties that no longer bind? The Patterns and Repercussions of Age-Articulated Migration,” The Professional Geographer, 61 (1), 4-20.
Metropolitan United States http://www.forbes.com/2010/06/04/migration-moving-wealthy-interactive-counties-map.html
Metropolitan United States View each county to see the urban hierarchy, go to http://www.forbes.com/2010/06/04/migration-moving-wealthy-interactive-counties-map.html
Metropolitan United States Regions within countries vary in per capita income because of their economy and metro size. United Kingdom: largest gap between the richest and poorest regions United States: District of Columbia is 5 times as rich as Mississippi Germany: even here, the most affluent regions are 3 times richer than the poorest Regional inequality has changed: worsened in U.S. and Britain; improved in Germany. Over a quarter of regions in Britain and Italy and one-tenth of those in Germany have a lower GDP per head than Shanghai. All the U.S. states remain richer, but Shanghai overtake Mississippi by 2015; within ten years half of all the states, including Florida, Michigan and Ohio, could have a GDP per head lower than Shanghai and Beijing.
First order Metropolitan United States High Order Nodal Regions of the USA Second order
Metropolitan United States 8) Why are large areas of the U.S. without second, and especially, third order cities?
Metropolitan United States 9) Historical developments of High Order Central Places in the U.S. -- also available on the Geography 111 web
Metropolitan United States Critical City Location in the “Land” Era, pre-1820 North America 1 3 Atlantic Ocean 2 4
Metropolitan United States Evolution of the U.S. Urban System 3 1 3 2 3 4 2 1 1 1 2 1 4 1 4 2 2 3 4 3 3 4 2 4 4 4 1 2 3 4
The growth in the number of huge metropolitan centers around the world will increase dramatically in the next decades, especially in the Majority/Third World. In 2007, half the world’s population already lived in cities, but that will not change the world-wide urban hierarchy of cities.