Download
1 / 35
350 likes | 502 Vues
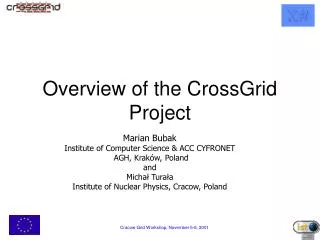
The European CrossGrid Project. Marcel Kunze Institute for Scientific Computing (IWR) Forschungszentrum Karlsruhe GmbH www.eu-crossgrid.org. Outline. Project Overview Applications Toolbox Experience (Testbeds). CrossGrid Collaboration. 21 institut e s 11 countries. Ireland:

E N D
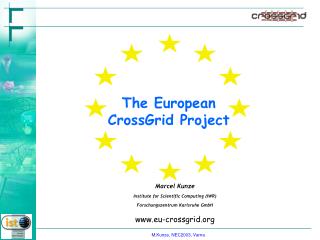
The European CrossGrid Project Marcel Kunze Institute for Scientific Computing (IWR) Forschungszentrum Karlsruhe GmbH www.eu-crossgrid.org
Outline • Project Overview • Applications • Toolbox • Experience (Testbeds)
CrossGrid Collaboration 21 institutes 11 countries Ireland: TCD Dublin Poland: Cyfronet & INP Cracow PSNC Poznan ICM & IPJ Warsaw Germany: FZK Karlsruhe TUM Munich USTU Stuttgart Netherlands: UvA Amsterdam Slovakia: II SAS Bratislava Austria: U.Linz Spain: CSIC Santander Valencia & RedIris UAB Barcelona USC Santiago & CESGA Greece: Algosystems Demo Athens AuTh Thessaloniki Portugal: LIP Lisbon Italy: DATAMAT Cyprus: UCY Nikosia
GRIA EUROGRID GRIP GRIDLAB DAMIEN DATATAG IST Grid Project Space EGSO Applications CROSSGRID DATAGRID Middleware Fabric Science Science Industry/Business
Mission Statement Development of a Grid Environment for Interactive Applications Make the Grid more user friendly, secure and efficient Timeline: 2002-2005
Workpackages • WP1 –Application Development • WP2 – Grid Application Programming Environment • WP3 – New Grid Services and Tools • WP4 – International Testbed Organisation • WP5 – Project Management
Architecture: Layered Structure Applications Middleware & Tools Fabric (Infrastructure)
Technical Components WP1 –Application Development WP2 –Programming Environment Interactive simulation and visualization ofa biomedical system Flooding crisis team support Distributed data analysis in HEP Weather forecast and air pollutionmodeling MPI code debugging and verification Metrics and benchmarks Interactive performance evaluation tools Visualization Kernel Data Mining High Level Architecture Grid Services: DataGrid GriPhyN ... WP3–New Services Portals and roaming access Grid resource management Grid monitoring Optimization of data access Globus Middleware WP4 – Testbeds - Fabric Infrastructure
Detailed Architecture Applications 1.1 BioMed 1.2 Flooding 1.3 Interactive Distributed Data Access 1.3 Data Mining on Grid (NN) 1.4 Meteo Pollution 2.2 MPI Verification 2.3 Metrics and Benchmarks 2.4 Performance Analysis 3.1 Portal & Migrating Desktop Supporting Tools Applications Development Support MPICH-G 1.1, 1.2 HLA and others App. Spec Services 1.1 User Interaction Services 1.1 Grid Visualisation Kernel 3.2 Scheduling Agents 3.4 Optimization of Grid Data Access 3.3 Grid Monitoring 3.1 Roaming Access DataGrid Replica Manager Globus Replica Manager Generic Services DataGrid Job Submission Service GRAM GridFTP GIS / MDS GSI Globus-IO Replica Catalog Replica Catalog Fabric Resource Manager (CE) Resource Manager (SE) Resource Manager Resource Manager 3.4 Optimization of Local Data Access CrossGrid DataGrid Globus CPU Secondary Storage Instruments ( Satelites, Radars) Tertiary Storage
Key Features of CrossGrid Applications • Data • Data sources and data bases geographically distributed • To be selected on demand • Processing • Large processing capacity required; both HPC & HTC • Interactive • Presentation • Complex data requires versatile 3D visualisation • Support for interaction and feedback to other components
Biomedical Application CT / MRI scan Segmentation Visualization LB flow simulation Medical Medical HDB VE DB DB WD PC PDA 10 simulations/day 60 GB/simulation > 20 MB/s Interaction
Interactive Treatment Planning The vascular geometry can be modified using a library of models Draw interactively Computational geometry
Flood Simulation Data sources Meteorological simulations Hydrological simulations Users Hydraulic simulations Output visualization
Distributed Data Analysis in HEP • Objectives • Distributed data analysis • Distributed data mining techniques with neural networks • Issues • Typical interactive requests will run on o(TB) distributed data • Transfer/replication times for the whole data about one hour • Data transfers once and in advance of the interactive session • Allocation, installation and set-up of corresponding database servers before the interactive session • Integration of user-friendly interactive access (based on PROOF)
Selection Parameters TagDB CPU Procedure PROOF DB1 RDB CPU Proc.C DB2 Proc.C DB3 CPU Proc.C DB4 CPU Proc.C DB5 CPU Proc.C DB6 CPU Parallel ROOT Facility: PROOF Local Remote http://root.cern.ch
Weather Forecast and Air Pollution Modeling • Distributed/parallel codes on the Grid • Coupled Ocean/Atmosphere Mesoscale Prediction System • STEM-II Air Pollution Code • Integration of distributed databases • Data mining applied to downscaling weather forecast
Migrating Desktop • Idea • Save and resume a user grid session • Look and feel of a windows desktop • Implementation • Roaming Access Server and Clients • Java Web Services (Portability) • Integration of Tools • Job submission wizard • Job monitoring dialog • GridExplorer dialog • GridCommander dialog
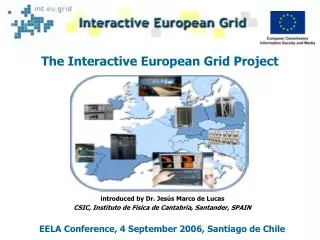
CrossGrid Testbeds Various instances: Production, Validation, Test Example sites: Valencia GoG farm, Santander (GridWall), FZK
Testbed Monitoring Mapcenter grid monitoring framework. Mapcenter was developed by DataGrid and adapted to CrossGrid. http://mapcenter.lip.pt
Production Resource Broker Statistics Graphics with RB statistics available from Mapcenter EDG 1.4
Production RB Statistics (continued) • Most of the failures are related with: • Authorization • Matchmaking • Testbed sites EDG 1.4
1980s: Internet 1990s: Web 2000s: Grid • Where do we need to get to ? • Applications to support an “e-society” (“Cyber-Infrastructure”) • A Grid infrastructure which hides the complexities from the users (“Invisible Computing”) • A powerful and flexible network infrastructure (GEANT 2) • Where do we need to invest ? • Applications targeted at realistic problems in “e-science” • Prototypes of Grid infrastructures • Maintain and improve the GEANT network • EU FP6 proposal: EGEE • Vision: Create European e-Infrastructure • 70 Partners, 31.5 MEuro • Start: April 2004