Download
1 / 18
180 likes | 261 Vues
Explore a cohort study analyzing surgical ward notes with stickers for improved adherence to HSE guidelines, enhancing patient safety and efficiency.

E N D
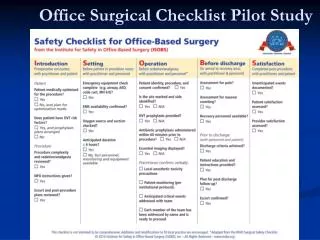
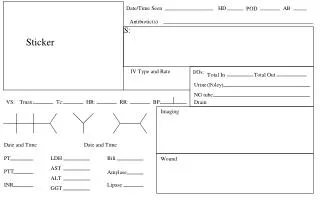
Sticker Checklist Study Professor Hill’s Team
Introduction • Medical notes and records were originally used as a reminder for doctors about their patient’s state of health.1 Nowadays, it is vital that any documentation recorded should be made in accordance with the Health Service Executive [HSE] Records Management standards. This is an official document providing clear guidelines to help enfore enhanced safety measures.2
The Study? A cohort study over eight days. There were two groups; a sticker study group and a control group, each consisting of 5 consultant teams. Based on these teams and their in-patients we were able to analyse data of 198 surgical ward round notes. This totaled to 34 study patients and 53 control patients.
How were the wardround notes analysed? • We checked for thirteen variables in the ward round notes. • We divided these variables into four groups; • Standard Criterion • Health Professional Data • Significant Clinical Data • Team Data • These variables abide by the HSE guidelines and must be present in any form of medical documentation. • Now for some statistics……
Average Adherence Percentage We calculated the average adherence percentage by adding Up the 13 variable and dividing it by 1300 and finally multiplying it by 100 :- Control group :- 69+100+95+23+1+2+93+95+98+34+40+25+43 = 718 (718/1300) * 100 = 55.2% Sticker group :- 100+100+94+85+100+100+100+100+100+48 +81+77+100= 1186 (1186/1300) * 100 = 91.2%
Conclusion • Based on these results, we would like to conclude that such a system can prove to be not only cost effective, but also a highly organised and efficient way to help adhere to the HSE standards. Overall increasing patient safety while minimising the workload.
Thanks • Any Questions???