Download
1 / 113
1.13k likes | 1.28k Vues
Tools for large graph mining WWW 2008 tutorial Part 4: Case studies. Jure Leskovec and Christos Faloutsos Machine Learning Department.

E N D
Tools for large graph miningWWW 2008 tutorialPart 4:Case studies Jure Leskovec and Christos Faloutsos Machine Learning Department Joint work with: Lada Adamic, DeepayChakrabarti, Natalie Glance, Carlos Guestrin, Bernardo Huberman, Jon Kleinberg, Andreas Krause, Mary McGlohon, Ajit Singh, and Jeanne VanBriesen.
Tutorial outline • Part 1: Structure and models for networks • What are properties of large graphs? • How do we model them? • Part 2: Dynamics of networks • Diffusion and cascading behavior • How do viruses and information propagate? • Part 3: Case studies • 240 million MSN instant messenger network • Graph projections: how does the web look like Leskovec&Faloutsos, WWW 2008
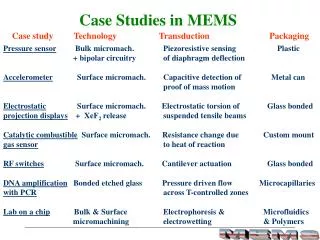
Part 3: Outline Case studies • Co-clustering • Microsoft Instant Messenger Communication network • How does the world communicate • Web projections • How to do learning from contextual subgraphs • Finding fraudsters on eBay • Center piece subgraphs • How to find best path between the query nodes Leskovec&Faloutsos, WWW 2008
Co-clustering • Given data matrix and the number of row and column groups k and l • Simultaneously • Cluster rows of p(X, Y) into k disjoint groups • Cluster columns of p(X, Y) into l disjoint groups Leskovec&Faloutsos, WWW 2008
Co-clustering • Let Xand Y be discrete random variables • X and Y take values in {1, 2, …, m} and {1, 2, …, n} • p(X, Y) denotes the joint probability distribution—if not known, it is often estimated based on co-occurrence data • Application areas: text mining, market-basket analysis, analysis of browsing behavior, etc. • Key Obstacles in Clustering Contingency Tables • High Dimensionality, Sparsity, Noise • Need for robust and scalable algorithms • Reference: • Dhillon et al. Information-Theoretic Co-clustering, KDD’03 Leskovec&Faloutsos, WWW 2008
n eg, terms x documents m k l n l k m Leskovec&Faloutsos, WWW 2008
med. doc cs doc med. terms cs terms term group x doc. group common terms doc x doc group term x term-group Leskovec&Faloutsos, WWW 2008
Co-clustering Observations • uses KL divergence, instead of L2 • the middle matrix is not diagonal • we’ll see that again in the Tucker tensor decomposition Leskovec&Faloutsos, WWW 2008
Problem with Information Theoretic Co-clustering • Number of row and column groups must be specified • Desiderata: • Simultaneously discover row and column groups • Fully Automatic: No “magic numbers” • Scalable to large graphs Leskovec&Faloutsos, WWW 2008
Cross-association • Desiderata: • Simultaneously discover row and column groups • Fully Automatic: No “magic numbers” • Scalable to large matrices • Reference: • Chakrabarti et al. Fully Automatic Cross-Associations, KDD’04 Leskovec&Faloutsos, WWW 2008
versus Row groups Row groups Column groups Column groups What makes a cross-association “good”? Why is this better? Leskovec&Faloutsos, WWW 2008
versus Row groups Row groups Column groups Column groups What makes a cross-association “good”? Why is this better? simpler; easier to describe easier to compress! Leskovec&Faloutsos, WWW 2008
What makes a cross-association “good”? • Problem definition: given an encoding scheme • decide on the # of col. and row groups k and l • and reorder rows and columns, • to achieve best compression Leskovec&Faloutsos, WWW 2008
details Cost of describing cross-associations sizei * H(xi) + Σi Total Encoding Cost = Description Cost Code Cost Main Idea Good Compression Better Clustering Minimize the total cost (# bits) for lossless compression Leskovec&Faloutsos, WWW 2008
l = 5 col groups k = 5 row groups k=2, l=2 k=2, l=3 k=1, l=2 k=3, l=3 k=3, l=4 k=4, l=4 k=4, l=5 Algorithm Leskovec&Faloutsos, WWW 2008
Algorithm Code for cross-associations (matlab): www.cs.cmu.edu/~deepay/mywww/software/CrossAssociations-01-27-2005.tgz Variations and extensions: • ‘Autopart’ [Chakrabarti, PKDD’04] • www.cs.cmu.edu/~deepay Leskovec&Faloutsos, WWW 2008
Microsoft Instant Messenger Communication Network How does the whole world communicate? Leskovec and Horvitz: Worldwide Buzz: Planetary-Scale Views on an Instant-Messaging Network, WWW 2008
The Largest Social Network • What is the largest social network in the world (that one can relatively easily obtain)? For the first time we had a chance to look at complete (anonymized) communication of the whole planet (using Microsoft MSN instant messenger network) Leskovec&Faloutsos, WWW 2008
Instant Messaging • Contact (buddy) list • Messaging window Leskovec&Faloutsos, WWW 2008
IM – Phenomena at planetary scale Observe social phenomena at planetary scale: • How does communication change with user demographics (distance, age, sex)? • How does geography affect communication? • What is the structure of the communication network? Leskovec&Faloutsos, WWW 2008
Communication data The record of communication • Presence data • user status events (login, status change) • Communication data • who talks to whom • Demographics data • user age, sex, location Leskovec&Faloutsos, WWW 2008
Data description: Presence • Events: • Login, Logout • Is this first ever login • Add/Remove/Block buddy • Add unregistered buddy (invite new user) • Change of status (busy, away, BRB, Idle,…) • For each event: • User Id • Time Leskovec&Faloutsos, WWW 2008
Data description: Communication • For every conversation (session) we have a list of users who participated in the conversation • There can be multiple people per conversation • For each conversation and each user: • User Id • Time Joined • Time Left • Number of Messages Sent • Number of Messages Received Leskovec&Faloutsos, WWW 2008
Data description: Demographics • For every user (self reported): • Age • Gender • Location (Country, ZIP) • Language • IP address (we can do reverse geo IP lookup) Leskovec&Faloutsos, WWW 2008
Data collection • Log size: 150Gb/day • Just copying over the network takes 8 to 10h • Parsing and processing takes another 4 to 6h • After parsing and compressing ~ 45 Gb/day • Collected data for 30 days of June 2006: • Total: 1.3Tb of compressed data Leskovec&Faloutsos, WWW 2008
Data statistics Activity over June 2006 (30 days) • 245 million users logged in • 180 million users engaged in conversations • 17,5 million new accounts activated • More than 30 billion conversations Leskovec&Faloutsos, WWW 2008
Data statistics per day Activity on June 1 2006 • 1 billion conversations • 93 million users login • 65 million different users talk (exchange messages) • 1.5 million invitations for new accounts sent Leskovec&Faloutsos, WWW 2008
User characteristics: age Leskovec&Faloutsos, WWW 2008
Age piramid: MSN vs. the world Leskovec&Faloutsos, WWW 2008
Conversation: Who talks to whom? • Cross gender edges: • 300 male-male and 235 female-female edges • 640 million female-male edges Leskovec&Faloutsos, WWW 2008
Number of people per conversation • Max number of people simultaneously talking is 20, but conversation can have more people Leskovec&Faloutsos, WWW 2008
Conversation duration • Most conversations are short Leskovec&Faloutsos, WWW 2008
Conversations: number of messages • Sessions between fewer people run out of steam Leskovec&Faloutsos, WWW 2008
Time between conversations • Individuals are highly diverse • What is probability to login into the system after t minutes? • Power-law with exponent 1.5 • Task queuing model [Barabasi ’05] Leskovec&Faloutsos, WWW 2008
Age: Number of conversations High User self reported age Low Leskovec&Faloutsos, WWW 2008
Age: Total conversation duration High User self reported age Low Leskovec&Faloutsos, WWW 2008
Age: Messages per conversation High User self reported age Low Leskovec&Faloutsos, WWW 2008
Age: Messages per unit time High User self reported age Low Leskovec&Faloutsos, WWW 2008
Who talks to whom: Number of conversations Leskovec&Faloutsos, WWW 2008
Who talks to whom: Conversation duration Leskovec&Faloutsos, WWW 2008
Geography and communication • Count the number of users logging in from particular location on the earth Leskovec&Faloutsos, WWW 2008
How is Europe talking • Logins from Europe Leskovec&Faloutsos, WWW 2008
Users per geo location Blue circles have more than 1 million logins. Leskovec&Faloutsos, WWW 2008
Users per capita • Fraction of population using MSN: • Iceland: 35% • Spain: 28% • Netherlands, Canada, Sweden, Norway: 26% • France, UK: 18% • USA, Brazil: 8% Leskovec&Faloutsos, WWW 2008
Communication heat map • For each conversation between geo points (A,B) we increase the intensity on the line between A and B Leskovec&Faloutsos, WWW 2008
Correlation: • Probability: Age vs. Age Leskovec&Faloutsos, WWW 2008
IM Communication Network • Buddy graph: • 240 million people (people that login in June ’06) • 9.1 billion edges (friendship links) • Communication graph: • There is an edge if the users exchanged at least one message in June 2006 • 180 million people • 1.3 billion edges • 30 billion conversations Leskovec&Faloutsos, WWW 2008
Buddy network: Number of buddies • Buddy graph: 240 million nodes, 9.1 billion edges (~40 buddies per user) Leskovec&Faloutsos, WWW 2008
Communication Network: Degree • Number of people a users talks to in a month Leskovec&Faloutsos, WWW 2008
Communication Network: Small-world • 6 degrees of separation [Milgram ’60s] • Average distance 5.5 • 90% of nodes can be reached in < 8 hops Leskovec&Faloutsos, WWW 2008