Download
1 / 19
190 likes | 297 Vues
A Dissection of Crude Oil Prices: 2007. Presented Before The Energy Forum January 30, 2007 By William H. Brown III President WHB Energy Research LLC. WHB Energy Research LLC. Independent Research On The International Oil and Gas Industry Energy Equity Research, All Major Sectors

E N D
A Dissection of Crude Oil Prices:2007 Presented Before The Energy Forum January 30, 2007 By William H. Brown III President WHB Energy Research LLC
WHB Energy Research LLC • Independent Research On The International Oil and Gas Industry • Energy Equity Research, All Major Sectors • Commodity Research, Oil and Natural Gas • Investment/Trading And Hedging Recommendations: Energy Stocks, Oil And Gas Prices, And Spread Relationships • Clients Include Mutual Funds, Hedge Funds, And Independent Oil And Gas Producers
Outline Of Presentation • Review “Layered” Crude Oil Price Thesis • Review Conclusions For 2006 Made One Year Ago • Review Historic Price/Inventory Relationships • Review Factors Impacting Atlantic Basin Light/Sweet Crude Oil Balance, 2001-2006 • Lay Out Modified Approach To Passive Length Analysis-June 2006 Update • Review Importance of Active Managed Fund Behavior As A Primary Intra-Year Price Determinant At The Margin • Put It All Together For 2007
The Thesis:Current Crude Oil Prices Are Composed Of Heterogeneous Layers • Base Layer: 2000-2003 Price/Inventory Relationships • Layer 2: 2001-2006 Shift In Atlantic Basin Fundamentals • Layer 3: Impact From “Passive” Length • Layer 4: Impact From “Active” CFTC-Reporting Funds • Caveat: Layers Are Not Mutually Exclusive, And A Multitude Of Factors Influence Decisions
Conclusions For 2006 Stated One Year Ago • Base Layer + Layer 2 Will Remain Intact Under Our Forecast Global Oil Balances, With Layer 2 Expanding Modestly. Therefore, A Complete Elimination Of Layer 3 Still Implies A Floor Of About $40.00 Per Barrel • Layer 3 Will Remain Intact, However, And Likely Increase, But Perhaps More Modestly Compared To 2004-2005 • Layer 4 (CFTC-Reporting Funds) Will Be A Primary Driver Of Prices At The Margin • Hypothetically Assuming A Potential Swing Reaching The 2005 Peaks In Both Net Shorts And Net Length Implies A Trading Range Of $62.00-$73.00 Per Barrel In The First Half Of 2006 • Second Half Of 2006 Will Witness The Beginning Of Longer-Term Fundamental Impacts, Including A Secular Moderation In U.S. Gasoline Demand Growth Note: Actual First Half 2006 WTI Range Was Approximately $58.00-$75.00 per Barrel; Second Half Prices Weakened Fundamentally As Expected, But Gasoline Demand Growth Did Not Moderate To The Extent Anticipated
Correlation Between U.S. Days Supply Of Crude Oil And Prompt NYMEX CL 2000 -0.55 2001 -0.52 2002 -0.67 2003 +0.35 2004 +0.04 2005 +0.44 2006 -0.10 Note: In 2006 There Was A Return To A Negative Sign, Although Poorly Correlated. Was This An Inflection Point When Traders Began To “Re-weight” Fundamentals?
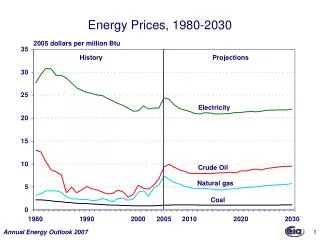
U.S. Inventory Vs. Prompt NYMEX CL Days Supply Prompt CL 2000 19.4 $30.26 2001 20.3 $26.04 2002 20.6 $26.16 2003 18.4 $31.12 2004 18.8 $41.43 2005 20.9 $56.71 2006 21.9 $66.18 Note: In 2006, Although Days Supply And Price Continued To Rise, There Was Some Deceleration Of Price Increase Relative To Rising Supply
Year-To-Year Change In The Atlantic Basin Low-Sulphur Crude Oil Balance, 2001-2006(MB/D) 2001 -375 2002 -65 2003 -400 2004 -1,090 2005 -410 2006 -800 Cumulative: -3,140
Fundamentally-Derived WTI Estimate For 2006 • The “Olden Day” (2000-2003) Price/Inventory Relationships Would Have Implied A 2006 WTI Average of $27.00 Per Barrel • The Cumulative Atlantic Basin Light/Sweet Crude Oil Deficit from 2001-2006 “Raised The Fundamental Bar”, Adding a $14.00 Per Barrel Estimated Fundamental Premium In 2006 • Therefore, Absent Any Financial Institution Impact On Crude Oil Prices, In 2006 WTI “Should Have Averaged” $41.00 Per Barrel • This Is Similar To Our Conclusions Made One Year Ago
Fundamental Picture And Price Implications For 2007 • Atlantic Basin Light/Sweet Crude Balance Will Ease In 2007, But Only Marginally, Due In Part To Moderation In Light Product Demand Growth • One Key Variable Is OPEC Capacity Utilization; A Review Of History Suggests Higher Capacity Utilization Means Higher Prices Only When OPEC Production Is “Demand Pulled” • View Of 2007 Suggests A Modest Decline In OPEC Capacity Utilization, But Largely Among Sour Producers • Therefore, Our Analysis Suggests That Fundamentals in 2007 Versus 2006 Will Have Only A $3.50 per Barrel “Decremental” Impact On WTI Average Versus 2006
The Price Impact Of “Passive” Length • Approach Was Revised In June 2006 Relative To Approach Discussed One Year Ago • Instead Of Taking Estimated Aggregate Dollar Crude Oil Passive Length Investment And Converting To NYMEX Contract Equivalents, Trends In CFTC-Reported Gross Commercial Length Were Analyzed • Estimates Had To Be Made Of The Growth And Absolute Level Of Gross Commercial Length That Reflected Index Buying/Counterparty Hedging, Since CFTC Has Not Yet Broken Out Index Buying of Crude Oil In Weekly Data • Model Concludes That Passive Length Added $21.00 Per Barrel To WTI In 2006, Consistent With Previous Analyses
Problem: Determine Change, If Any, In Passive Length In Response To Returns • This Exercise Is Required For Forecasting Purposes • Impossible To Determine Every Barrel Of Passive Length In Every Form In The Market • Multiple Indices Of Varying Crude Oil Weight, Off Exchange Structured Notes, And Other Instruments Comprise A Heterogeneous “Layer” • After Looking At Several Possibilities, However, We Used Correlations Between Our Estimated CFTC Commercial Share of Volume Devoted To Passive Length And Goldman Sachs Commodity Index Total Return • GSCI Was Used Due To Combination Of Heavy Crude Oil Weighting (High Correlations Between Combined Crude Oil “Flat” Price + Term Structure Return and Total GSCI Returns) And Longer History
Does Passive Length Respond To Returns On A Continuous Basis? Coincident Correlation: Estimated Passive Length Share Of Commercial Volumes Vs. GSCI Total Return 2003 .14 2004 .82 2005 .74 2006 -.44 Coincident Correlation Turned Negative In 2006 Because Passive Length Investment Continued To Rise While GSCI Realized A Negative Total Return Due To Crude Oil’s Minimal BOY-EOY Price Change Combined With The Negative “Roll”
Or, Does Passive Length Respond To Returns On A Lagged Basis, i.e. Making Investment Decisions Based On The Previous Year’s Performance? Lagged Correlation: Estimated Passive Length Share Of Commercial Volumes Vs. GSCI Total Return 2004 .46 2005 .85 2006 .87 The Lagged Correlation Continued To Improve As Passive Length Rose, Perhaps Suggesting That Indeed Investors Responded To The Progressive Gains In The GSCI Total Return In Hindsight And Did Not Reduce Passive Length During 2006 In Response To The Negative Returns of 2006
The Importance And Price Implications For 2007 Of A Lagged Investor Response To Passive Length Returns • If Passive Length Changes Discretely, As Opposed To Continuously, Based On Prior Year Returns, It Is Significant Because Once The Investment Decision Is Made, There May Not Be Continuous Intra-Year Changes In Passive Length Which Would Compound Any Major Intra-Year Rise Or Fall In Price Due To Other Factors • Our Analysis Suggests That Because Of Negative GSCI Returns In 2006, There Will Be Some Reduction Or “Reallocation” Of Passive Length In 2007, But No Elimination • We Estimate A “Decremental” Passive Length Price Impact Of $3.00 Per Barrel In 2007 Versus 2006
CFTC-Reporting “Active” Fund Profile Non-Comm. Non-Comm. Traders: Long Traders: Short 2003 44 45 2004 60 65 2005 63 87 2006 84 95 Non-Comm. Non-Comm. Contracts/Trader: Long Contracts/Trader: Short 2003 1,603 1,535 2004 2,012 1,296 2005 1,900 1,240 2006 1,958 1,457
Quantifying The CFTC-Reporting Active Managed Fund Impact In 2006 And 2007 • Active Managed Commodity Funds That Report To The CFTC Do Change Positions Continuously Within A Given Year, Thus Differentiating Themselves From Passive Investors And Play The Primary Non-Fundamental Role Of Price Determination At The Margin • Based On Analysis Of Price Versus Change In Net Fund Position During Discrete Time Periods In 2006, We Estimate That CFTC-Reporting Active Managed Funds (Non-Commercials) Had A Net Positive Crude Oil Price Impact Of $4.00 Per Barrel Last Year • If TheseFunds Were To Go Net Short Or Net Long In 2007 To The Extent Of The Highs Of The Last Two Years, It Would Theoretically Have A Negative Impact On Price Of $7.75 Per barrel Or A Positive Impact On Price Of $14.10 Per Barrel, All Relative To Our Fundamental + Passive Length Price Base
Putting It All Together 2006 Actual WTI Average: Approx. $66.00 Less: Net Positive Impact Of Active Funds -$4.00 Implied Fundamental + Passive Length 2006 Average “Base”: $62.00 2007 Price Calculation: Fundamental Change From 2006: -$3.50 Passive Length Change From 2006: -$3.00 Base 2007 Price, Assuming Active Funds “Flat”: $55.50 Potential Trading Range Due To Active Funds: $47.75 to $69.60
Market Bias In 2007 • However, We Believe Geopolitical Factors Will Give A Net Positive Bias To Active Fund Positions In 2007, Thus Yielding An Effective WTI Average Of About $60.00 Per Barrel, Our Base Case Forecast For 2007 Ever Since Last Summer • Our Long-Standing $60.00 Per Barrel Forecast Average Has Assumed A $55.00 Per Barrel First Quarter Average, Reflecting Early-Year Passive Length Reduction/Reallocation, Lower OPEC Capacity Utilization Relative To Subsequent Quarters, And Other Seasonal Factors. • Our $63.00 Per Barrel Forecast Second Quarter Average Reflects A Tighter Atlantic Basin Crude Oil Balance, A Rise In OPEC Capacity Utilization, And Active Funds Assuming A Constructive U.S. Gasoline Market • Second Half Prices Stabilize and Ease, Reflecting A Rebalancing Of The First And Second Quarter Factors