
Uploaded by
fallon
0 SLIDES
126 VUES
0LIKES
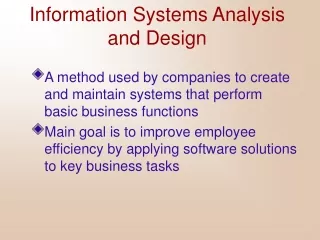
Information Systems Analysis and Design
DESCRIPTION
Information Systems Analysis and Design. Systems Modeling. Enterprise Model graphically represents organizational entities and the relationships between entities A process model represents a system ’ s functions (data flow diagrams)
Download

1 / 0
Télécharger la présentation 
Information Systems Analysis and Design
An Image/Link below is provided (as is) to download presentation
Download Policy: Content on the Website is provided to you AS IS for your information and personal use and may not be sold / licensed / shared on other websites without getting consent from its author.
Content is provided to you AS IS for your information and personal use only.
Download presentation by click this link.
While downloading, if for some reason you are not able to download a presentation, the publisher may have deleted the file from their server.
During download, if you can't get a presentation, the file might be deleted by the publisher.
E N D
Presentation Transcript
-
Information Systems Analysis and Design
- Systems Modeling Enterprise Model graphically represents organizational entities and the relationships between entities A process model represents a system’s functions (data flow diagrams) A data model represents a system’s data and the relationships between data elements (entity relationship diagram) An object model represents a system’s classes including attributes, methods and relationships
- Process Modeling Graphically represent the processes that capture, manipulate, store, and distribute data between a system and its environment and among system components Utilize information gathered during requirements determination Processes and data structures are modeled
- Pizza Delivery Example 4. confirmation Customer 1. Coupon, order address payment type Sales 2. wait time 3. order details 10. Pizza Database 5. order 7. address 11. Payment Chef 9. Pizza collected 6. order done 12. Payment received Delivery 8. Pizza
- Doors-R-Us Service Example Process: Materials Manager 8. Work Order Dispatcher Accounts Receivable Clerk 9. Installer 10. 7. 6. Receptionist 11. Bill 2. Customer 5. 1. 3. Salespeople Estimator 4. Quote
- Doors-R-Us Process Explanation 1. Salespeople get potential customers familiar with company/services 2. When potential customer needs a door service, they call HQ, get the receptionist 3. Receptionist finds estimator (HQ /road) to visit customer and assess situation 4. Estimator inspects site and submits quote to warehouse manager 5. If customer decides to use Doors-R-Us, calls HQ (receptionist) to request service 6. Receptionist finds dispatcher to schedule the work 7. Dispatcher and customer agree on time for service
- Doors-R-Us Process Explanation 8. Dispatcher gets needed supplies from Materials Manager 9. Dispatcher sends an installer to get the replacement door and install it 10. Installer writes up a work order and submits to A/R Clerk 11. A/R Clerk sends bill to Customer
- Process Modeling Deliverables and Outcomes Context data flow diagram (DFD) Scope of system DFDs of current physical and logical system Enables analysts to understand current system DFDs of new logical system Technology independent Show data flows, structure, and functional requirements of new system Thorough description of each DFD component
- Data Flow Diagram (DFD) A picture of the movement of data between external entities and the processes and data stores within a system Difference from system flowcharts: DFDs depict logical data flow independent of technology Flowcharts depict details of physical systems
- DFD Symbols
- Data Flow Symbols (cont.) Data Store Depicts data at rest May represent data in File folder Computer-based file Notebook The name of the store as well as the number are recorded in between lines 8.12
- Data Flow Symbols (cont.) Process Depicts work or action performed on data so that they are transformed, stored or distributed Number of process as well as name are recorded Data flow: arrows depicting movement of data 8.13
- Data Flow Symbols (cont.) Source/Sink Depicts the origin and/or destination of the data Sometimes referred to as an external entity Drawn as a square symbol Name states what the external agent is Because they are external, many characteristics are not of interest to us 8.14
- DFD Diagramming RulesProcess No process can have only outputs or only inputs…processes must have both outputs and inputs. Process labels should be verb phrases.
- DFD Diagramming RulesData Store All flows to or from a data store must move through a process. Data store labels should be noun phrases.
- DFD Diagramming RulesSource/Sink No data moves directly between external entities without going through a process. Interactions between external entities without intervening processes are outside the system and therefore not represented in the DFD. Source and sink labels should be noun phrases.
- DFD Diagramming RulesData Flow Bidirectional flow between process and data store is represented by two separate arrows. Forked data flow must refer to exact same data item (not different data items) from a common location to multiple destinations.
- DFD Diagramming RulesData Flow (cont.) Joined data flow must refer to exact same data item (not different data items) from multiple sources to a common location. Data flow cannot go directly from a process to itself, must go through intervening processes.
- DFD Diagramming RulesData Flow (cont.) Data flow from a process to a data store means update (insert, delete or change). Data flow from a data store to a process means retrieve or use. Data flow labels should be noun phrases.
- Functional Decomposition An iterative process of breaking a system description down into finer and finer detail High-level processes described in terms of lower-level sub-processes DFD charts created for each level of detail
- DFD Levels Context DFD Overview of the organizational system Level-0 DFD Representation of system’s major processes at high level of abstraction Level-1 DFD Results from decomposition of Level 0 diagram Level-n DFD Results from decomposition of Level n-1 diagram
- Context Diagram Context diagram shows the system boundaries, external entities that interact with the system, and major information flows between entities and the system. NOTE: only one process symbol, and no data stores shown.
- Level-0 DFD Level-0 DFD shows the system’s major processes, data flows, and data stores at a high level of abstraction. Processes are labeled 1.0, 2.0, etc. These will be decomposed into more primitive (lower-level) DFDs.
- Level-1 DFD Level-1 DFD shows the sub-processes of one of the processes in the Level-0 DFD. This is a Level-1 DFD for Process 4.0. Processes are labeled 4.1, 4.2, etc. These can be further decomposed in more primitive (lower-level) DFDs if necessary.
- Level-n DFD Level-n DFD shows the sub-processes of one of the processes in the Level n-1 DFD. This is a Level-2 DFD for Process 4.3. Processes are labeled 4.3.1, 4.3.2, etc. If this is the lowest level of the hierarchy, it is called a primitive DFD.
- Nested DFD Level 0 1.0 2.0 EE1 D1 Level 1 Level 1 EE1 1.1 D2 D1 2.1 2.2 1.2 Level 2 2.3 1.2.1 1.2.2
- A Simple DFD Example: Customer Order Process for CD On-Line Customers select the CDs they would like to order and communicate their selected CD item numbers and their customer account number to CD On-Line. Based on the customer’s selection, the order is processed by calculating the order total amount. The order total and customer account number as well as the customer’s old credit balance (from the customer credit database) are used to update the customer’s new credit balance. The new balance should be recorded on the customer credit database.
- A Simple DFD Example: Customer Order Process for CD On-Line (cont’d) The detailed order data from order processing and updated customer credit balance information are used to prepare a customer invoice and invoice information is updated. Detailed invoice data are used to prepare a shipping list and the invoice is sent to the customer on-line. The shipping list information is sent to UPS. (Based on a partnership relationship between CD On-Line and UPS, UPS warehouses the CDs and ships the CDs to the customers based on the shipping list).
- Translating into DFD Vocabulary External Entities Customer UPS Internal Entity: CD On-Line Data Store Customer credit
- Translating into DFD Vocabulary Process Compute order total Update customer credit account balance Prepare invoice Prepare shipping list Data Flows CD item numbers Customer account number Old/New balance Order data
- DFD Balancing The conservation of inputs and outputs to a data flow process when that process is decomposed to a lower level Balanced means: Number of inputs to lower level DFD equals number of inputs to associated process of higher-level DFD Number of outputs to lower level DFD equals number of outputs to associated process of higher-level DFD
- Unbalanced DFD This is unbalanced because the process of the context diagram has only one input but the Level-0 diagram has two inputs. 1 input 1 output 2 inputs 1 output
- Balanced DFD 1 input 2 outputs These are balanced because the numbers of inputs and outputs of context diagram process equal the number of inputs and outputs of Level-0 diagram.
- Balanced DFD (cont.) These are balanced because the numbers of inputs and outputs to Process 1.0 of the Level-0 diagram equals the number of inputs and outputs to the Level-1 diagram. 1 input 4 outputs
- Data Flow Splitting A composite data flow at a higher level may be split if different parts go to different processes in the lower level DFD. This remains balanced because the same data is involved, but split into two parts.
- More DFD Rules
- Four Different Types of DFD Current Physical Process labels identify technology (people or systems) used to process the data. Data flows and data stores identify actual name of the physical media. Current Logical Physical aspects of system are removed as much as possible. Current system is reduced to data and processes that transform them.
- Four Different Types of DFD (cont.) New Logical Includes additional functions Obsolete functions are removed Inefficient data flows are reorganized New Physical Represents the physical implementation of the new system
- Current Context Diagram
- Current Physical DFD
- Current Logical DFD
- New Logical DFD
- Do we need all four DFDs? Focus on new logical (then start)! Make all only when Analysts know little about the user’s business Users cannot start with new logical DFD Little works for conversion from old logical DFD to New DFD Don’t waste too much time on details of current DFDs.
- Guidelines for Drawing DFDs Completeness DFD must include all components necessary for system. Each component must be fully described in the project dictionary or CASE repository. Consistency The extent to which information contained on one level of a set of nested DFDs is also included on other levels.
- Guidelines for Drawing DFDs (cont.) Timing Time is not represented well on DFDs. Best to draw DFDs as if the system has never started and will never stop. Iterative Development Analyst should expect to redraw diagram several times before reaching the closest approximation to the system being modeled.
- Guidelines for Drawing DFDs (cont.) Primitive DFDs Lowest logical level of decomposition Decision has to be made when to stop decomposition
- Guidelines for Drawing DFDs (cont.) Rules for stopping decomposition When each process has been reduced to a single decision, calculation or database operation When each data store represents data about a single entity When the system user does not care to see any more detail
- Guidelines for Drawing DFDs (cont.) Rules for stopping decomposition (continued) When every data flow does not need to be split further to show that data are handled in various ways When you believe that you have shown each business form or transaction, online display and report as a single data flow When you believe that there is a separate process for each choice on all lowest-level menu options
- Using DFDs as Analysis Tools Gap Analysis The process of discovering discrepancies between two or more sets of data flow diagrams or discrepancies within a single DFD Inefficiencies in a system can often be identified through DFDs.
- Using DFDs in Business Process Reengineering Example: IBM Credit See Figure 7-20 – before reengineering Credit approval process required six days before BPR Figure 7-21 depicts DFD after reengineering IBM was able to process 100 times the number of transactions in the same amount of time
- Using DFDs in BPR After: process 100 times as many transactions in the same time Before: Credit approval process required six days
- Oracle’s Process Modeler and Functional Hierarchy Diagrams Process Modeler Unique to Oracle Similar to DFDS but outputs and methods differ in several ways. Table 8-4 illustrates differences Functional Hierarchy Diagrams Picture of various tasks performed in a business and how they are related Tasks are broken down into their various parts Does not include data flows


More Related
Audio
Live Player