(Nat Cat) Risk Management
Climate Change Quantification of business impacts by means of catastrophe modeling leading to tailormade risk transfer solutions Or: Nat Cat Reinsurance – how it works and what it needs. (Nat Cat) Risk Management. Identification/Awareness

(Nat Cat) Risk Management
E N D
Presentation Transcript
Climate ChangeQuantification of business impacts by means of catastrophe modeling leading to tailormade risk transfer solutionsOr: Nat Cat Reinsurance – how it works and what it needs
(Nat Cat) Risk Management • Identification/Awareness • perception is based on a shared mental model that can be conceptualized • Quantification • From conceptual to quantitative model • Mitigation • Explore/quantify options through quantification • Transfer • costing of options: need for integrated models: loss costs (expected loss), cost of capital (or ‘for capacity’) • portfolio management diversification • Market: price the option and trade etc. generic conceptualize apply integrate specific
Reality and Model Reality To be more precise: Perceived reality
Reality and Model Reality Model
Reality and Model: Proportions Reality Model additional perils Economy Legal Framework Society Environment
Reality and Model: What can be described Reality Model Unrealistic? Not modeled Modeled Reality Model: Abstraction Described in Model Model Reality: Interpretation (Verification/Falsification/Calibration)
Reality and Model: Development Reality Model conceptional incremental Unrealistic? Not modeled Modeled Reality Model: Abstraction Described in Model Model Reality: Interpretation
Reality and Model: Development Reality Model conceptional incremental Unrealistic? Not modeled Modeled Reality Model: Abstraction Described in Model Model Reality: Interpretation Be reminded: Perceived reality
Nat Cat loss model4 elements Hazard Vulnerability Value distribution Cover conditions How strong?How frequent? How well built and protected? What exactly is covered ... where... and how? • Sums insured • Cover limits • Deductibles • Exclusions • etc.
Example: Detailed Single Event SimulationLiterally hundred thousands of such simulations are run in e.g. the catXos Nat Cat model to assess a portfolio
probabilistic~100‘000 events~10‘000 years TC North Atlantic – probabilistic (zoom) North Atlantic tropical cyclone event set historic~1000 events~100 years
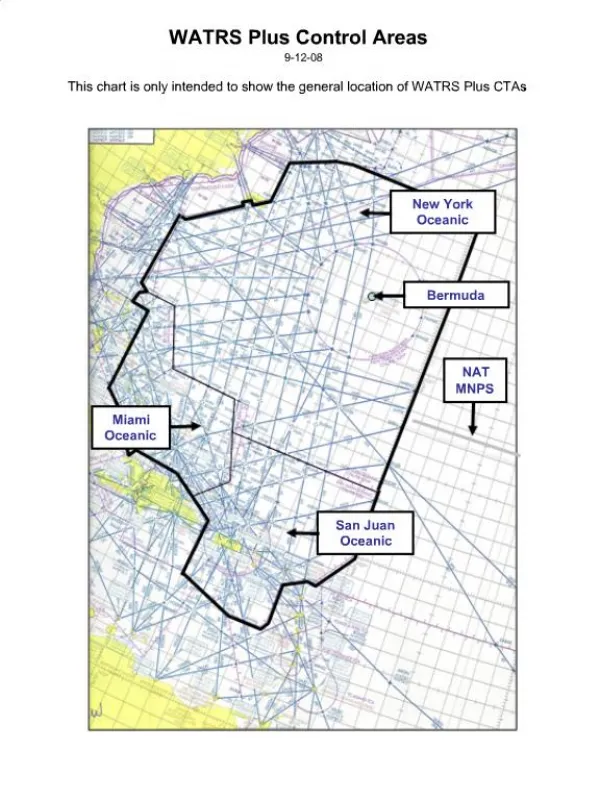
35 Storm Europe The largest loss potentials 110 75 Hurricane US+Carib. (100y) Quake California • Peak risks: • Earthquake or storm • In industrialisedcountries • With high insurancedensity Quake Japan 50 45 Typhoon Japan 19 20 7.2 JER 8.4 Daria 1990 FHCF2007 Northridge 1994 Mireille 1991 Katrina 2005 Insurance loss potentials in USD billions: Nat cat events (indexed to 2006, source: sigma 2007) Loss potentials from events with a return period of 200 years (100 years for Hurricane North Atlantic) FHCF: Florida Hurricane Catastrophe Fund state-run JER: Japan Earthquake Reinsurance Scheme schemes
How will climate change impact the re/insurance industry? Possible change in mean AND variance
Model results The next 100 years:Increasing variability summer heatwave What has been exceptional in 2003 might become usual by 2070 Source: Schär et al., Nature 2004
Model results The next 100 years:Increasing variability summer heatwave What has been exceptional in 2003 might become usual by 2070 Source: Schär et al., Nature 2004
The effects of climate change: Storm damage in Europe on the rise Climate change is affecting winter storms in Europe. Based on the findings of a scientific study, Swiss Re forecasts a significant rise in damage from storm events in the long term, creating additional risk for society and insurers to manage CORNELIA SCHWIERZ1, PAMELA HECK2, EVELYN ZENKLUSEN1, DAVID N. BRESCH2, CHRISTOPH SCHÄR1, PIER-LUIGI VIDALE1 and MARTIN WILD1 1) Institute for Atmospheric and Climate Science, ETH Zürich, Schweiz 2) Swiss Reinsurance Company, Zürich, Schweiz
IPCC Scenarios Future, A2 Current, Control Source: IPCC 2007, Summary for Policy Makers
European Winter StormsGoal and Methodology Compare wind storm losses on a Europe-wide property insurance portfolio in current and future climate conditions: • Use 3-dimensional global climate models (Int. community, ETH) • Drive regional climate models over Europe with initial and boundary conditions from global models (ETH) • Couple windfields (climate model output) with Swiss Re’s state-of-the-art loss model(probabilistic storm hazard set for current and future climate conditions)
European Winter StormsClimate Change Impact Increase in annual expected loss for the period 2071–2100 compared to a 1961–1990 reference period: Climate models show an increase in both storm severity and frequency. Climate model 1 Climate model 2 Climate model 3 Swiss Re loss model 68% 48% 16% Source: Schwierz et al, Modelling European winter windstorm losses in current and future climate, submitted to climatic change
Climate Impact StudiesOn-going Joint Projects • Winterstorm Europe • MeteoSwiss, Zürich (NCCR climate), see P. Della Marta • Tropical Cyclones North Atlantic • University of Bern, (NCCR climate) • Flood Europe • EC Joint Research Center, Ispra, Italy • Drought and Subsidence Europe • ETH, Zürich (NCCR climate) • Sea Level Rise, Coastal Risks • University of Bern, GKSS Hamburg • Tropical Cyclones West Pacific • City University of Hong Kong (more general study, done)
Conclusions • Past and Present Climate • solid base period longer re-analysis period, better representation of extremes (‘tail events’) • comprehensive probabilistic set (multimodel) ensemble based re-analysis • variables to best represent the cause of loss gust better than mean wind, flood water level better than run-off ( e.g. coupled hydrological and hydraulic models) • reasonable resolution to capture local risk and consistent spatial signals footprint (dependency) • Future climate • Avoid surprises, abrupt change (prevention, mitigation, adaptation) • Near future (decade) of more immediate concern (from time-slice to continuum) • Ceterum censeo: Easy data access (at adequate costs, simple legal terms)
Further reading www.swissre.com Research & Publications Swiss Re publishing David_Bresch@swissre.com