Download
1 / 39
390 likes | 571 Vues
Outcomes of COP 17 in Durban. 7 February 2012. COP17 historical context. 1997 COP3 Kyoto Protocol agreed for 2008-2012 2009 COP15 Copenhagen disappointment a “big-bang” approach not politically feasible 2010 COP16 Cancun Multilateral process on life support

E N D
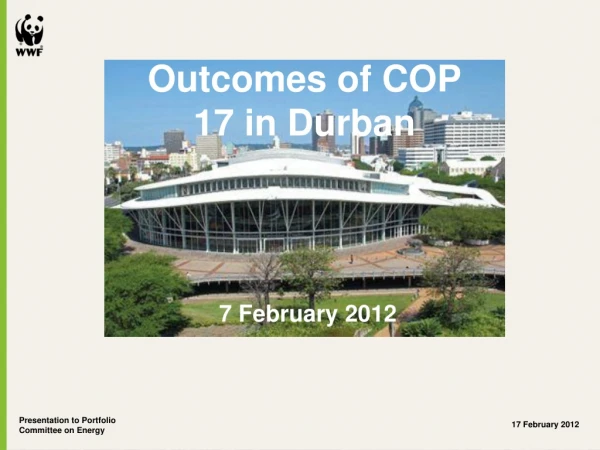
Outcomes of COP 17 in Durban 7 February 2012
COP17 historical context • 1997 COP3 Kyoto Protocol agreed for 2008-2012 • 2009 COP15 Copenhagen disappointment • a “big-bang” approach not politically feasible • 2010 COP16 Cancun • Multilateral process on life support • Return to incremental progress. • Global goal of 2oC with a review of adequacy in 2013/15 • Commitment to mobilise $100 billion per year by 2020 • Trust restored to some extent • Difficult issues kicked to Durban. • 2011 COP17… • Difficult Geopolitical context • World facing many crisis: Increasing emissions, debt crises, recession, climate change…
COP17 geopolitical context • EU – internal debt crisis, only 11% of global CO2 emissions, want much wider deal • China, India –> strong growth, developing economies, major emitters, & won’t accept same quality/definition of ‘commitments’ as historically responsible countries • Brazil, South Africa, Mexico fairly progressive emerging economies • AOSIS, Africa Group and LDCs – First, hardest impacts –> moral authority • US – Election year, Strong Republican climate denialist movement, recession
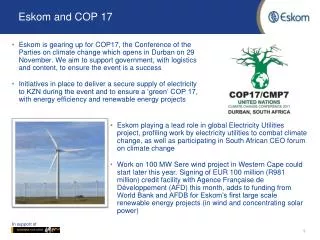
South Africa’s role at COP17 • COP Presidency • Achieved political outcome they wanted – prevent breakdown and death of KP on African soil • Innovative methods introduced – Indaba’s, the dramatic huddle • SA Delegation • Relatively good objectives • Did not achieve all elements of a balanced package
COP17 Outcomes 3. Second Commitment Period of Kyoto Protocol Given all of this what did we get in Durban? 1. Operationalising Cancun agreements 4. Durban Platform for Enhanced Action (DPEA) 2. Green Climate Fund (GCF) • 5. A massive Ambition gap
COP17 outcomes • Operationalising Cancun agreements • Adaptation Committee • Technical Progress on Monitoring Reporting and Verification (MRV) • Progress on Reducing Emissions from Deforestation and Forest Degradation (REDD+) • On Technology there was progress on building institutions such as the Technology Mechanism, comprising the Technology Executive Committee and Climate Technology Center and Network (CTNC) to be made operational in 2012. • Possible opportunities for localisation of technology production in SA, especially in Renewable energy and SMART grid technology.
COP17 outcomes • OperationalisingCancun agreements • Green Climate Fund (GCF): • Durban agreed on the operationalisation of the GCF • The GCF is the “operating entity of the Financial Mechanism of the Convention” – will manage part of $100 billion that has been promised • Has to allocate money from Developed Country contributions to mitigation and adaptation activities in Developing Countries • World Bank is the interim trustee • No funds in the fund… • Work programme on sources set out • Likely future sources: International transportation taxes and Financial Transaction Taxes (FTTs) • SA implications: In future funding will be available for mitigation and adaptation actions that can prove merit
COP17 outcomes • Operationalising Cancun agreements • Green Climate Fund (GCF): • KP CP2 • Top-down science and rule based approach • 5 or 8 years? • EU stands alone? • Australia, New Zealand in/out? • Canada, Japan, Russia out • Durban Platform for Enhanced Action (DPEA) • “Also decides to launch a process to develop a protocol, another legal instrument or an agreed outcome with legal force under the Convention applicable to all Parties…” • \
COP17 outcomes • Operationalising Cancun agreements • Green Climate Fund (GCF): • KP CP2 • Durban Platform for Enhanced Action (DPEA) • Ambition gap
What does this mean going forward? • Multilateral process still afloat • On track for 4oC world – more ambition required • Pledge and review down for the count? • Firewall dissolving – “Applicable to all parties” • Equity will be the big fight • Carbon constrained future for all countries • Deal by 2020
COP17 implications for SA • SA will face a carbon constrained future • A low carbon economy will be a competitive advantage in the medium term and an imperative in the long term • Slow transition will leave expensive infrastructure investments stranded. E.g. Kusile is expected to operate until at least 2070 • SA can be a market leader or a late-acting technology and economically dependent country • Either way a carbon budget approach to planning will be necessary: • The NCCR white paper has already set a process in motion • Each economic sector has to develop low carbon development strategies - including the Energy sector
COP17 implications for SA energy sector • Energy mix in Integrated Resource Plan 2012 (IRP) • Existence is admirable as a first step but • A simple mix is not good enough • Electricity supply set to account for at least ½ of SA’s carbon emissions • Impossible to move to a Low Carbon Economy when energy supply is so carbon intensive
COP17 implications for SA energy sector – Mitigation options • Reducing the carbon budget of our energy sector can be achieved through: • The implementation of a Carbon Tax • Integrated Energy Planning • These are not just environmentally sound policies but also good economic policy
Carbon Tax Implementation • At the moment the externalised costs of fossil fuels are still borne by society as a whole through: • The degradation of the health of our people and costs of health care (sp. respiratory disease) • declining water quality and water catchment functionality, • costs of environmental regulation, enforcement and rehabilitation - e.g. Witwatersrand AMD from gold and uranium mining • the destruction of the ecosystems on which we rely for our livelihood and • the costs of the floods and droughts ravaging our cities and infrastructure. • A Carbon Tax will ensure that these costs are accurately reflected in price structures
Carbon Tax Implementation: Safeguards against adverse impacts • 3. Clear long-term scale up trajectory • 1. Builds on the strength of SARS • 4. Use of revenue to offset impacts, particularly on the poor 2. Shifting the tax base from household income and spending to taxing the exploitation of natural resource endowments • 5. Low initial level
COP17 implications for SA energy sector – Mitigation options • Reducing the carbon budget of our energy sector can be achieved through: • The implementation of a Carbon Tax • Integrated Energy Planning incl. • Renewable energy generation • Decentralised generation • Smart grids • Localisation • Demand side planning - Efficiency is the cheapest fuel • Energisation including electrification • Unbundling Power distribution, transmission and generation • Working for energy
Integrated Energy Planning • Government has direct influence in the electricity sector • Moving to Renewable Energy holds many benefits: • eliminating energy poverty / ensuring universal energy access • Off grid energy sources have low transmission costs • Energy access benefits biodiversity through reducing unsustainable biomass harvesting • Social benefits of access to modern energy services include: • Electric pumps to provide clean water • Refrigeration of food and medicines • Less time spent collecting firewood and water leading to more time to invest in children and/or livelihoods • Electrical lighting • Possible solutions include solar cooking, more efficient cook stoves, biogas digesters and improved charcoal burning techniques.
Integrated Energy Planning • Government has direct influence in the electricity sector • Moving to Renewable Energy holds many benefits: • eliminating energy poverty / ensuring universal energy access • Reduced carbon footprint of the energy sector • Increased security of energy supply • Improved risk portfolio of the energy supply mix • If full externality costs are included, Renewable energy is a competitive, cost effective energy source • SARI is a very positive step towards addressing capital cost barriers to entry • The return on investment for RE through mitigation and social benefits of job creation and clean, sustainable energy provision is better than for other energy sources • Potential for decentralisation of energy supply ownership
Integrated Energy Planning • Government has direct influence in the electricity sector • Moving to Renewable Energy holds many benefits: • Potential for decentralisation of energy supply ownership • Current centralised energy system is over-reliant on minerals sector • Concentrates wealth and power • Decentralised energy generation can keep value/wealth within communities • Decentralised energy production leads to improved climate resilience due to dispersed risk of multiple sources • E.g localised biomass use – biogas digestors and/or gasification and low-grade biodiesel for generator sets • Working for Energy programme
Energy Trade-offs • WWF acknowledges the trade-offs that need to be considered in Energy planning viz. • energy security, • job creation, • localization, • CO2 emissions, • water impacts, • social impacts No single factor should trump all others.
Renewable Energy vs Nuclear Energy • Insufficient capital or skills for deep and efficient localisation of both power sources • Renewable energy technology is a better investment of limited resources i.t.o: • Dispersed generation leading to potential for broad ownership, • employment creation potential, • climate change mitigation and adaptation, • short lead times for getting power into the grid, • universal energy access through decentralised generation, • optimal resource utilisation and • availability of environmental goods and services (sp. water)
Renewable Energy vs Nuclear Energy WWF therefore rejects any proposals for an increased nuclear reactor fleet in South Africa, renewable energy technology is a better investment of limited resources
Renewable Energy vs Unconventional gas 3. Construction • No-go zone • determination 4. Active mining 2. Exploration, drilling, site preparation • Post-mining and • decommissioning
Renewable Energy vs Unconventional gas • Four Areas of Concern • Air pollution • Investment required • Water Implications • Job creation
Renewable Energy vs Unconventional gas • Air pollution • Methane is a 20x more potent GHG than CO2 • CO2 emissions alone are worse than for coal. • In areas of the USA with drilling local air quality is significantly reduced • Each well drilled once will emit 348-438 metric tonnes of CO2. • Over 20 years the GHG footprint for shale gas is 20%-100% greater than that for coal per quantity of energy available during combustion • 3.6 to 7.9% of the total gas production of the each well is emitted to the atmosphere as methane
Renewable Energy vs Unconventional gas • Air pollution • Investment required • The enormous amounts of heavy equipment needed to FRACK and pump water and all entail massive transportation-related emissions and infrastructure development in remote areas of South Africa • Investment trade-off with RE
Renewable Energy vs Unconventional gas • Air pollution • Investment required • Water Implications
Potential Impacts on Water Resources Construction Phase Mining Phase Post-mining Phase Altered hydrological regimes Altered geo-hydrological regimes Increased acidity, heavy metals & salts Risk of surrounding water contamination
Renewable Energy vs Unconventional gas • Air pollution • Investment required • Water Implications • Resource scarcity and Pollution • Thermogenic methane levels are 17 times higher in groundwater supplies within 1 km of fracking wells in USA • Requires 50-100 times the water needed in conventional gas wells • Average estimates of water usage at a single gas well range from 7.56 million litres to 30 million litres • 30% to 70% of the fracking fluid initially remains underground and continues to surface for the life of the well
Renewable Energy vs Unconventional gas • Air pollution: • Investment required • Water Implications • Job creation • Transient • Far from people • Not comparable to RE
Renewable Energy and Unconventional Gas Based on several fundamental uncertainties and unknowns, WWF currently strongly rejects any proposals for the moratorium on fracking to be lifted until independently reviewed data substantiate the claims of industry. In our view, renewable energy technology is a better investment of limited resources.
Other Significant Trends • The UNFCCC has established a work-programme on sources of funding for the GCF • Two possible new sources of finance gaining support: • Tax on international transport fuel (specifically shipping) • No-net incidence on developing countries through rebates • If UN/IMO continues slow progress further unilateral action is possible similar to Airline tax in EU-ETS • FTTs • A global transaction tax of 0.1% could yield between US$410 billion and US$1060 billion a year. • A levy of 0.005% on currency transactions on all major currencies in dealer markets would yield US$33 billion a year. • Large scale predictable source of funding with little adverse impact
South Africa has played a strong leadership role in COP17 by saving the international process. Now we start a just transition to a sustainable economy by making the right energy investment choices! A winner never, neverNever stays behindA winner comes a quick run farA winner don't give upA winner breaks the recordA winner is ready for talkYes, a winner is on the moveA winner is the moodA winner is on the runA winner is never down Hugh Masekela: Don't Go Lose It Baby
+100 +5,000 WWF is in over 100 countries, on 5 continents WWF has over 5,000 staff worldwide 1961 >5 Million WWF was founded In 1961 WWF has over 5 million supporters www.wwf.org.za