Download
1 / 95
960 likes | 1.3k Vues
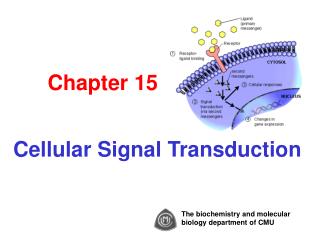
[VII]. Regulation of Gene Expression Via Signal Transduction. Reading List VII: Signal transduction Signal transduction in biological systems. External Signal Regulating the Expression of Genes. Signals. Signal transduction cascades. Gene Expression. or.

E N D
[VII]. Regulation of Gene Expression Via Signal Transduction Reading List VII: • Signal transduction • Signal transduction in biological systems
External Signal Regulating the Expression of Genes Signals Signal transduction cascades Gene Expression or Cytoplasmic mechanism/muscle contraction/etc. New Proteins mRNAs Proteins
Communication between Matting Yeast Cells • Yeast cells use chemical signaling to communicate with the opposite mating types and initiate mating process • Two mating type factors are a and b • The mating factors are peptides of about 11 amino acid residues • Receptors on the surface of the yeast cells recognize the specific mating type factor
Communication among Bacteria Aggregation in progress Individual cells Spore forming Myxobacteria (Myxococcus xanthus, slime bacteria) use chemical signaling to share information about nutrient availability. When food is limited, starving cells secrete a molecule that enters neighboring cells and stimulate them to aggregate. The cells form a structure that produces thick-walled spores capable of surviving until the environment improves.
Characteristics of Signals • Have specificity: unique, can only be detected by the molecular machinery designed for the detection • Small and easy traveling to the site of action • Easily made, mobilized, altered relatively quickly, and easily destroyed
Synthesis and release of signaling molecules by signaling cells (step 1&2) Transport of signaling molecules to the target cells (step 3) Binding of the signaling molecule with a specific receptor protein on the membrane leading to activation (step 4) Signaling Via Cell-Surface Receptors (I)
Initiating one or more intracellular signal-transduction pathways initiated by the activated receptor (step 5) Specific change in cellular response (cellular function, metabolic change or gene expression) (step 6a & 6b) Removal of the signal to terminate the cellular response (step 7) Signaling Via Cell-Surface Receptors (II)
Different Ways Cells Signal Each Other Endocrine signaling Paracrine signaling Autocrine signaling Signaling by plasma membrane-attached proteins
Chemical Identity of Signals Peptides & Protein Hormones (most abundant): e.g., thyrotropin, Gonadotropin releasing hormone (GnRH), growth hormone (GH), prolactin (PRL), Insulin etc. Amino Acid Derivatives: thyroid Hormone, epinephrien Steroid Hormones: testosterone, estrogen, cortisone etc. Lipids: prostaglandin & retinoic acid Nucleotides: cAMP, cytokinins, 1-methylalanine Oligosaccharides: α-1,4-oligogalaturonide Gases: CO, ethylene etc.
Receptor Proteins Exhibit Ligand-Binding & Effector Specificity Dimers • Each ligand binds to its specific receptor due to binding specificity and the receptor-ligand complex in turn will exhibit a specific effect (effector specificity) • Different receptors of the same class that bind different ligands often induce the same cellular response in a cell
kon R + L RL koff [R] . [L] [RL] Receptor Ligand Interaction At equilibrium: Where [R] and [L] are the concentration of free receptor & ligand at equilibrium. [RL] is the concentration of the receptor-ligand complex. Kd is the dissociation constant koff Kd = = kon And Ka (association constant) = 1/Kd = [RL]/[R].[L] From this equation, one can see that Ka equals to the ratio of bound [RL] to free ligand [L]
Binding Assays Are Used to Detect Receptors and Determine Their Kd Values • Binding assay is used to demonstrate the presence of receptors. Both the number of the ligand-binding sites per cell and the Kd value are easily determined from the binding assay • Figure in the left shows the binding of ligand (insulin) to the receptors with high affinity (Free Ligand) • High affinity binding, Kd = 10-8 M or lower; Low affinity binding, Kd = 10-7 M or higher (larger) • If the Kd is larger than 10-7 M, the bound ligand can easily fall off the receptors in the process of separating unbound ligand from the bound ligand. A competitive binding assay can be used instead
Scatchard Plot • Slop= -1/Kd • n = number of receptors ~ number of binding sites • From this plot, one can easily figure out Kd and number of the binding site of the receptor -
Scatchard Plot • If the plot gives a bi-phasic line, it means that the receptor contains multiple binding sites with different affinities or the presence of multiple receptors binding to the same ligand
Primary translationproduct of IGF-I E B C A D S Post-translationalprocessing Signal peptide S B C A D E Mature IGF-I E-peptide Insulin-Like Growth Factor (IGF) I
Multiple Forms of Pro-IGF-I E-Peptide Mature IGF-I E Human pro-IGF-Ia B C A D Human pro-IGF-Ib Human pro-IGF-Ic Trout pro-IGF-I Ea-4 Trout pro-IGF-I Ea-3 Trout pro-IGF-I Ea-2 Trout pro-IGF-I Ea-1
Induces morphological differentiation and inhibits anchorage-independent growth in oncogenic transformed cell lines (Chen et al., 2002; Kuo and Chen, 2002) Inhibits tumor cell growth and invasion, and tumor-induced angiogenesis in developing chicken embryos (Chen et al., 2007) Induces programmed cell death of cancer cells (Chen et al., 2012) Up-regulate fibronectin 1 and laminin receptor genes and down-regulate uPA, tPA and TIMP1 genes (Siri and Chen 2006a, 2006b; Chen et al., 2007) Anti-Tumor Activities of the Pro-IGF-I E-peptide
Is there a specific membrane receptor present on the membrane of cancer cells that binds to E-peptide? To answer this question, we used binding assay to demonstrate the presence of specific receptor molecules on the membrane cancer cells
Binding of 35S-E-Peptide to SK-N-F1 Cells Human Eb-peptide Trout Ea4-peptide Kd = 2.9 ± 1.8 x 10⁻¹¹ M Kd = 2.9 ± 1.8 x 10⁻¹¹ M
Competitive Displacement Assay • Labeled hEb was competed out with unlabeled hEb • Labeled rtEa4 was competed out with unlabeled rtEa4
Competitive Displacement Assay C. Labeled hEb competitive with unlabeled rtEa4 • Labeled rtEa4 competitive with unlabeled hEb
Competitive Binding Assay with hIGF-I The data suggest that E-peptide does not bind to the same receptor that binds IGF-I
Use of a Competitive Binding Assay to Detect Binding of Low Affinity Ligands to Receptors • One way to determine weak binding of a ligand to its receptor is in a competition assay with another ligand that binds to the same receptor with higher affinity • Alprenolol, a synthetic high affinity ligand to epinephrine receptor; Epinephrine, natural hormone; isoproternol, an antagonist to epinephrene. • The Kd of the competitor can be determined at the 50% competition. The Kd for epinephrine is 5 x 10⁻⁵ M
Maximal Physiological Response to Many External Signal Occurs When Only a Fraction of the Receptor Molecules are Occupied by Ligand • In all signaling systems, the affinity for any signaling molecules to its receptor must be greater than the normal physiological level of the signaling molecule • Take insulin for example, the kd of insulin to its receptor is 1.4 x 10⁻¹⁰M, and the circulating insulin is 5 x 10-12M. By substituting these number into the equation: Kd= [R][L]/[RL], at equilibrium, about 3% of the total insulin receptors are bound by insulin. If the circulating concentration of insulin rises five fold to 2.5 x 10⁻¹¹M, the number of the receptor-hormone complexes will rise about 5 fold to 15% of the total receptors are bound by insulin • In many cases, the maximum cellular response to a particular ligand is induced when less than 100% of its receptors are bound to the ligand. The example is shown in the figure above
Sensitivity of a Cell to External Signals is Determined by the Number of Surface Receptors • The cellular response to a particular signaling molecular depends on the number of receptor-ligand complex. The fewer receptors present on the surface of the cell, the less sensitive is the cell to the ligand • In the erythroid progenitor cells, the Kd for binding of erythropoietin (Epo) is 10-10 M. Only 10% of the 1000 cell-surface erythropoietinreceptors must be bound to ligand to induce maximum cellular response. By following the equation below, we can calculate the [L] needed to induce the response: Kd [L] = RT/ [RL] - 1 • Where [RT] = [R] + [RL] • If the RT=1000, Kd = 10-10 M, [RL] = 100, the [Epo] = 10-11 M will elicit the maximal response. If RT = 200, 10-10 M of erythropoietin will be required to occupy 100 receptors to elicit the maximum response
Purification of Membrane Receptors • Membrane receptors can be purified by: • Affinity binding method • Label the ligand with isotope • Binding of the labeled ligand to cells that may contain the desired receptor, washing off the unbound ligand and covalent bound the ligand to the receptor • Isolate the membrane fraction, dissolve the membrane protein and purify the receptor • Affinity Chromatography • Link the ligand to beads (agarose or polyacrylamide) and pack the beads in a column • Pass the crude extract of membrane fraction containing receptors through the column, wash column several times to remove the contaminants • Elute the column with excess amounts of ligand and the receptor will be eluted from the column • These methods are suitable for the isolation of high affinity membrane receptors
A Functional Assay to Confirm the Identity of a Receptor cDNA • Once a receptor is purified, the partial sequence of the receptor can be identified mass spectrometer analysis. This information can be used to clone the full-length cDNA of the receptor • The identity of the receptor cDNA can be confirmed by the method depicted in the figure on the left of this slide • An expression construct with the full-length of receptor cDNA is transfected into a cell line that dose not have the endogeneous receptor in question. The transfected cells will express the desired receptor which can be detected by receptor binding assay
Reading List VII: • Isolatiion and characterization of colagen receptor • Isolation of interleukins by immunoaffinity-receptor affinity chromatography • Isolation, characterization and regulation of the prolactin receptor • Isolation and characterization of human prolactin receptor
The General Structure of a Membrane Receptor • A signal molecule binds to a receptor protein, causing to change shape • Most signal receptors are plasma membrane proteins • G-protein-coupled receptor, tyrosine kinase receptor, ligand-gated ion-channel receptor etc.
Receptors Activate a Limited Number of Signaling Pathways (I) There are seven classes of membrane receptors that can receive external signaling molecules: G-protein-coupled receptors, cytokine receptors, receptor tyrosine kineses, TGFb receptors, Hedgehog receptors, Wnt receptors, Notch receptor External signals induces two types of cellular responses: Change in the activity or function of specific pre-existing proteins (Activating enzymes) Changes in amounts of specific proteins produced by a cell as a result of activation of genes (gene expression) Signaling from G-protein-coupled receptors often results in changes in the activity of pre-existing proteins, but it can also result in activation of gene expression
The other classes of receptors operate primarily to modulate gene expression: The activated TGFb and cytokine receptors directly activate a transcription factor in the cytosol The Wnt receptors assemble an intracellular signaling complex to the cytosol transcription factors Tyrosine receptor kinases activate several cytosolic protein kinases that translocate into nucleus and regulate the activity of nucleus transcription factors Some classes of receptors can initiate signaling via more than one intracellular signal-transduction pathways, leading to different responses. This is typical of G-protein-coupled receptors, receptor tyrosine kinases and cytokine receptors Only limited number of signal transduction mechanisms are responsible for signal transduction Receptors Activate a Limited Number of Signaling Pathways (II)
Four Common Intracellular Second Messenger • Besides signaling molecules from outside of the cells, there are additional micromolecules from inside of the cells that are involved in signal transfer. These are second messengers • Second messengers carry and amplify signals from receptors • Binding of the signaling molecules to many cell surface receptors leads to a short-lived increase in the concentration of low molecular weight intracellular signaling molecules (i.e. second messengers) • These molecules include cAMP, cGMP, DAG, IP3, Ca++, and inositol phospholipids(phosphoinositide embedded in cellular membranes)
Appropriate Cellular Responses Depend on Interaction and Regulation of Signal Pathways Activation of a single type receptor often leads to production of multiple second messengers which have different effects The same cellular response may be induced by activation of multiple signaling pathways. Such interaction of different signaling pathways permits the fine-tuning of cellular activities required to carry out complex developmental and physiological processes Regulation of signaling pathways is critical for the cell to response to signals properly Cells down regulate the effects of signal transduction processes by degrading second messengers, deactivate signal transduction proteins, desensitizing the receptors or removing the signaling molecules by endocytosis etc.
Overview of Cell Signaling Reception Transduction Response The components of intracellular signal transduction pathways are highly conserved
Signal Transduction Pathways Signal on the membrane receptors will be transduced by a multi-step pathway in order to amplify a signal Protein phosphorylation by protein kinase is a major mechanism of signal transduction Unlike receptor tyrosine kinases, cytoplasmic protein kinases do not phosphorylate themselves but phosphorylate other substrate proteins on serine/threonine residues (serine/threonine kinase) About 1% of our genes are thought to code for protein kinases, indicating the importance of protein kinases in the cell The activated protein kinases are quickly reversed by protein phosphatases
Protein Kinases Protein kinases and phosphatases are used in virtually all signaling pathways Protein kinases: enzymes add phosphate groups to the OH-group of tyrosine, serine or threonine of its own or other proteins Phosphatases: enzymes remove phosphate groups from proteins In human genome, there are at least 600 genes encoding for different protein kinases and 100 genes encoding different phosphatases In some of the signaling pathways, receptor itself possesses intrinc kinase activity. It can phosphorylate itself upon binding to its ligand The activity of all protein kinases is opposed by the activity of protein phosphatases
G-Protein Coupled Receptors • G-protein-coupled receptors that regulate ion channels • G-protein-coupled receptors that activate or inhibit adenylyl cyclase • G-protein-coupled receptors that activate phospholipase C • Activation of G protein-coupled receptors leading to gene expression • Receptor Tyrosine Kinase
General Elements of G Protein-Coupled Receptors G protein-coupled receptors (GPCRs) are the most numerous class of receptors found in organisms from yeast to human All GPCR signaling pathways share the following common elements: A receptor that contains seven membrane-spanning elements (transmembrane domains) A coupled trimeric G protein which functions as a switch by cycling between active and inactive forms (activator or inhibitory) A membrane-bound effector protein Feedback regulation and desensitization of the signaling pathway A second messenger also occurs in many GPCR pathways, and these components are modular and can be mixed and matched GPCR pathways have short term effects in cells by quickly modifying existing proteins or enzymes or ion channels, but also long term effects involving change in transcription leading to differentiation
General Structure of G Protein-coupled Receptor • G Protein-coupled receptors are a large and diverse families with a common structure and function • GPCR activate exchange of GTP for GDP on the a-submit of a Trimeric G protein • G-protein coupled receptors consists of hydrophobic amino acids that allow proteins to be stabled anchored in the hydrophobic core of the membrane (seven membrane spanning domains) • Loops C3 and C4 are involved in binding to G protein. In some cases, C 2 is also involved • There are several sub-families of G protein-coupled receptors with high conservation of amino acid sequence and structure
Switching Mechanism for Monomeric & Trimeric G Proteins • External signals induce two types of cellular responses: • Change the activity or function of specific enzymes or proteins • Change the amount of proteins in the cell via modification of transcription factors • Trimeric and monomeric G proteins: GTPase Switch Proteins, belong to GTPase superfamily proteins. These guanine nucleotide-binding proteins are turned “on” when bound to GTP and turned “off” when bound to GDP. The signal-induced conversion from the inactive to active state is mediated by a guanine nucleotide-exchange factor (GEF) • Subsequent binding of GTP induces a conformational change in two segments of the G protein, switch I and II, allowing the protein to bind to and activate other downstream signaling proteins • The rate of GTP hydrolysis is enhanced by GTPase-activating protein (GAP) and a regulator of G protein signaling protein (RGS)
Activation of Effector Proteins Associated with G Protein-Coupled Receptors • G protein-coupled receptors activate exchange of GTP for GDP on the a subnit of a trimeric G protein • A built-in feedback mechanism is present to make sure that the effector protein is only activated for a short period of time
Different G proteins are activated by different GPCRs and in turn regulate different effector proteins • Adenylyl cyclase and phospholipase C are different effectors
Hormone-Induced Activation and Inhibition of Adenylyl Cyclase in Adipose Cells • Binding of ligan to Gas or Gai protein activates or inhibits adenylyl cyclase to synthesize cAMP • cAMP, in turn, activates cAMP-dependent protein kinase that phosphorylate target proteins • PGE1: postaglandin
cAMP Activates Protein Kinase A by Releasing Catalytic Submits • cAMP-dependent protein kinase has regulatory and catalytic submits • Binding of cAMP to the regulatory submit results in release of the catalytic submits
Synthesis and Degradation of Glycogen Is Regulated by Hormone-Induced Activation of Protein Kinase A • Adding of glucose to glycogen is catalyzed by glycogen synthetase, and removal of glucose moiety from glycogen is by glycogen phosphorylase • Glucose-1-phosphate is converted to G-6-P in the liver and then de-phosphorylated by phosphatase and released into blood stream • Epinephrine-stimulated activation of adenylyl cyclase resulted in increase of cAMP which in turn activates protein kinase leading to increase of G-1-P from glycogen glycogenolysis
Regulation of Glycogen Metabolism by cAMP in Liver and Muscle Cells
cAMP-mediated activation of protein kinase A produces diverse responses in different cell types. It is phosphorylated at ser and thr in a motif: X-Arg-(Arg/Lys)-X-(Ser/Thr)-Φ where X denote any AA and Φ, hydrophobic AA