Download
1 / 19
200 likes | 226 Vues
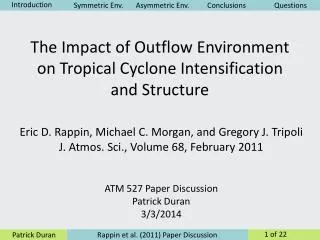
This comprehensive study explores environmental factors impacting Tropical Cyclone (TC) structure evolution. It delves into low-wind environments, uniform flow conditions, and vertical wind shear effects on TC development. The paper examines how factors such as air-sea interactions and environmental moisture impact TC intensity and structure changes. Insights from model simulations and observational data are discussed, shedding light on the importance of shear values and TC sensitivity to size and intensity. The study also addresses the influence of upper-level trough interactions and moisture effects on TC behavior, offering recommendations for further research in the field.

E N D
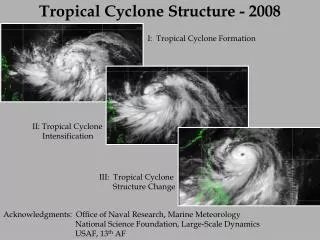
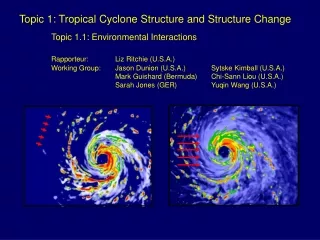
Topic 1: Tropical Cyclone Structure and Structure Change Topic 1.1: Environmental Interactions Rapporteur: Liz Ritchie (U.S.A.) Working Group: Jason Dunion (U.S.A.) Sytske Kimball (U.S.A.) Mark Guishard (Bermuda) Chi-Sann Liou (U.S.A.) Sarah Jones (GER) Yuqin Wang (U.S.A.)
Introduction Environmental factors that affect TC structure • Low- or no-wind environments • Uniform flow environments • Vertical wind shear environments • Upper-level troughs • Environmental moisture (or lack thereof) • Air-sea interaction (topic 1.3)
Low- or no-wind environments • wind field is near zero throughout the troposphere Unusually axisymmetric and intense TCs have been observed to form under extremely weak easterly shear environments (Knaff et al. 2003)
Low-shear environment Variable Coriolis • Low- or no-wind environments Model simulations of weak vertical shear environments (< 4 m s-1) produce a structure that looks similar to the annular hurricanes. Simulated TCs are 10-12 hPa deeper than a TC in a variable coriolis environment. 3 m s-1 resultant shear 6 m s-1 beta shear 3 m s-1 environment shear Ritchie and Frank 2006a
(Kwok and Chan 2005 JAS) 2. Uniform flow environments wind field is near constant throughout the troposphere • No observational studies of TCs in uniform environmental flow? • West zonal flow more favourable for TC intensification than east zonal flow • Hypothesis 1 (Peng et al. 1999; Dengler and Keyser 2000): that westerly zonal flow partially cancels the northwestward motion induced by beta gyres – weaker convective asymmetry develops • Hypothesis 2 (Kwok and Chan 2005): that westerly zonal flow partially cancels the northwesterly shear induced by beta gyres – weaker convective asymmetry develops
Shear? Z 200 850 X Shear? Z 200 850 X 3. Vertical Wind Shear Mean wind field changes with height What is an appropriate measure of shear? Does it matter? 200 hPa – 850 hPa = 10 m s-1 (over 650 hPa) Spread evenly through the layer 200 hPa – 850 hPa = 10 m s-1 (over 650 hPa) Concentrated in the lower part of the layer
3. Vertical Wind Shear • - Dry Vortex Studies:- • exhibit resiliency in the presence of vertical shear • (Reasor et al. 2004; Jones 2004) • Mechanisms:- • 1) tilted vortex rotates such that when vortex is tilted upshear, the shear reduces the vortex tilt – stable, oscillating feature dependant on the Rossby penetration depth. Tilt is downtilt-left (Jones 2004) • 2) Asymmetries project onto vortex Rossby waves and damp reducing the tilt of the vortex (weakening mechanism?) (Reasor et al. 2004)
3. Vertical Wind Shear Intensity trends:- • - Observations: critical shear value for Atlantic ~1.4 m s-1 (100 hPa)-1 • critical shear value for w-NPac ~1.7 m s-1 (100 hPa) -1 • (Gallina and Velden 2002) • - Simulations: critical value ~1.5 m s-1 (100 hPa)-1 • (Wong and Chan 2004) • Lag time between onset of shear and TC weakening • – both obs and simulations • (Frank and Ritchie 2001; Gallina and Velden 2002) Sensitivity to size/intensity of TC:- - Observations: under same shear, more intense TCs weaken more slowly (Gallina and Velden 2002) - Simulations: smaller TC weakened in less shear than larger TC (Wong and Chan 2004)
3. Vertical Wind Shear cont… 0545 UTC 12 July 1132 UTC 12 July • Potential correlation between IR cloud structure and shear Zehr 2003 • Calculate: • Centroid of area of cold clouds within circle • Distance of centroid to the known center of TC • Direction of centroid from the known center of TC • - Demonstrates relationship to SHIPS vertical wind shear
3. Vertical Wind Shear cont… From Rogers et al. 2003 MWR
3. Vertical Wind Shear cont… Temperature Tangential Wind Vertical Wind • TC Vertical Structure - AMSU observational results More favorable composites wind shear < 7.5 m s-1 Less favorable composites wind shear > 7.5 m s-1 (Knaff et al. 2004, MWR) Correlates nicely with modeling study by Ritchie and Elsberry (2001, MWR)
4. Upper-level trough interactions • No new research in trough – TC interactions (except as a part of ET) was identified !!!
120 80 40 0 Intensity (kt) Erin emerges from SAL 5. MOISTURE EFFECTS SAL Outbreak Hurricane Erin 5 - 15 September 2001 GOES-8 Channel 5 Minus Channel 4 (color enhanced)
3-Day Animation of Cloud Condensate (UW-NMS) Non-SAL (left)SAL (right)
3-Day Animation of Cloud Condensate (UW-NMS) • Preliminary results (independent of wind shear effects) suggest: • Non-SAL storm: significantly faster genesis…10 % greater intensity (MSLP drop) after 3 days…generates 40% more precipitation…~50% larger in area • SAL storm: tends to become more asymmetrical
Wettest, out to 250 km Wettest, out to 600 km Dry-air intrusion(Kimball 2006, MWR) Moisture Profiles Central SLP traces
Recommendations 1. Recent advances in understanding environmental effects with idealized and real-data cases need to be converted to conceptual models that are applicable in real-time, operational intensity-change and structure forecasting. 2. Physical factors that determine how the TC responds to “good troughs” and “bad troughs” need to be documented. 3. Physical processes and the warm core evolution during TC weakening in response to vertical wind shear need to be described from real data cases and modeled in dynamic models. 4. A more physical representation of vertical shear needs to be determined.
< 10 m s-1 15 - 17 m s-1 Knaff et al. 2004