Download
1 / 43
430 likes | 602 Vues
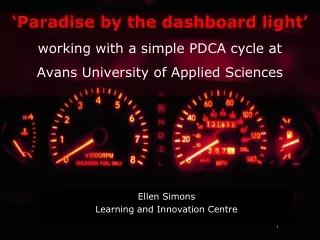
‘ Paradise by the dashboard light ’ working with a simple PDCA cycle at Avans University of Applied Sciences. Ellen Simons Learning and Innovation Centre. Avans University of Applied Sciences. 3 locations 24.000 students 103 bachelor’s programs 5 master’s programs 22 research groups

E N D
‘Paradiseby the dashboard light’working with a simple PDCA cycle at Avans University of Applied Sciences Ellen Simons Learning and Innovation Centre
Avans University of Applied Sciences • 3 locations • 24.000 students • 103 bachelor’s programs • 5 master’s programs • 22 research groups • 2.000 staff • 1 Learning and Innovation Centre Den Bosch Breda Tilburg
Organizational chart Learning and Innovation Centre 90 fte’s 120 staff working in Breda, Den Bosch and Tilburg
Aim PDCA-cycle • Streamlining • Discipline • Transparancy Diagram by Karn G. Bulsuk (http://blog.bulsuk.com)
Quality system • Basic quality system (2009- ) • Implement PDCA-cycle parallel to P&C-cyclus Avans • Perspectives of the Balanced Score Card required • Institutional audit in 2013 • quality assurance systems of the support departments critically examined
Plan:Design or revise business process components to improve results
Planning process Businessplan Mission/goals Avans Hippo- campus Avans & ICT Long-term policy Avans 2011-2014 Business-plan LIC Plans Schools
Business Plan 2011 Vision Mission Targets Strategy Activity budget Targets Results + Business Plan 2011 Staff planning 2011-2014
From Business Plan to team activity Plans Vision Mission Targets Strategy Training Business-plan 2011 Formation Team-activity plans
Business Plan 2011 Vision Mission Targets Strategy Targets Results + Activity budget Business Plan 2011 Staff planning 2011-2014
Janssen, Paula Timesheet June 2010 Activities Total hours
Check: Assess the measurements and report the results to decision makers
Accountability Discussion Executive board Avans Management LIC Team-managers LIC Staff LIC
Introducing the dashboard • Overview of performance figures on a quarterly basis • More effective way of reporting • Accountability of • Meeting specified goals • Realization Business Plan • Goals and results on the basis of agreed performance indicators • General dashboard for executive board and internal dashboards per team
Internal/ Organization perspective Financial perspective Customer perspective Innovative/ learning perspective Critical Success Factor Critical Success Factor
Dashboard: Customer perspective • Goals and activities focussed on customers • Xplora/Learning Centre: • Customer satisfaction Xplora • Total visitors • Virtual Learning Environment ‘Blackboard’ • Customer satisfaction • Total visitors Black Board
Dashboard: Financial Perspective • Staff in fte’s • Permanent and temporary • Total available fte’s • Flexible part fte’s • Average staff costs • Regular operation cost • Staff costs • Total regular income • Total regular expenses • Achieved operating-balance • Projects
Dashboard: Internal perspective • Hours registered • Percentage of hours spent • Reduce absenteeism • Employee satisfaction
Activities Learning and Innovation Centre Plus services Innovation projects General Business Training Services
Dashboard: Innovative/learning perspective • Goals and activities in Business plan focused on innovation • Number of visited conferences • Number of external presentations
Plan: Design or revise business process components to improve results
Near future 2011-2012 • Introduction of analysis and reflection according to the C of the PDCA-cycle • Preparation institutional audit in 2013 • quality assurance systems of the support departments critically examined • Enhanced quality • Where do we want to excel?
“ It's a iterative working routine that is constantly improved, which for me as a member of the board is getting more convenient all the time and allows me to understand where the LIC stands and where it is headed”. drs. M.M.J. Kamsma MBA/MBI Member executive board Avans University of Applied Sciences
“It's trustworthy if an organization as LIC governs her own processes in enough detail to see things they ought to see for their own sake, and mature enough for me to give understanding how things develop in risk and control as a whole”. Henri Vossen Concern Controller Avans University of Applied Sciences
“The situation changes daily, so you've got to keep your finger on the pulse”. Rien Brouwers Director Learning and Innovation Centre
“The PDCA gives me clarity and overview”. Linda Brouwers Teammanager Learning and Innovation Centre
"Working with the PCDA-cycle provides insight, information and guidance about my team. It promotes making strategic choices”. Sandra Brocx Teammanager Learning and Innovation Centre
Fear: “I didn't know I spend that incredible amount of hours on information skills workshops”. Relief : “I spend much more time than I thought on advising schools”. Insight: “I really need to delegate some activities, organize them differently or even stop some activities”. Niek Van Hoof-Verhagen Information specialist Learning and Innovation Centre
“Necessary adjustments to processes can now be based on objective information”. Ellen Simons Deputy Director Learning and Innovation Centre
Recommendations • Keep it simple • Don’t use it as a top-down control instrument for staff • Produce a factsheet with facts & figures!
Further Information: • Ellen Simons E-mail: pmg.simons@avans.nl • Slideshare http://www.slideshare.net/pmgsimon/ • Facts and Figures Learning and Innovation Centre 2010 http://lic.avans.nl/index.php/en/over-het-lic/facts-and-figures