Download

1 / 58
590 likes | 739 Vues
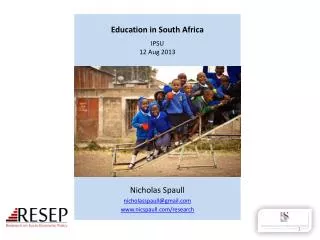
Education in South Africa IPSU 3 September 2012. Nicholas Spaull nicholasspaull@gmail.com www.nicspaull.com/research. Outline for todays lecture. Theory of education in SA Two education systems not one What is the state of education in SA? Local and international assessments

E N D
Education in South AfricaIPSU3 September 2012 Nicholas Spaull nicholasspaull@gmail.com www.nicspaull.com/research
Outline for todays lecture • Theory of education in SA • Two education systems not one • What is the state of education in SA? • Local and international assessments • What are some of the causes of low performance?
Theory – education in SA • Type of tertiary education (quality) - institution and field of study • Demand and supply • Individual motivation • Parental IQ (assortative mating) • Maternal health • Nutrition • Early cognitive stimulation: preschool (quantity & quality), home environment South Africa • Average school SES • Language of learning & teaching (LOLT) • Teacher quality • Peer effects • Subject choice • Cost of tertiary education (explicit & implicit costs) • Parental & personal aspirations and perceptions • Society/culture (See Taylor, 2010)
Background to SA Education • Primary schooling • High school • Subject choice • Matric • University/FET
School’s in SA Public schools ?
Teaching Characterised by: • High cognitive demand • Full curriculum coverage • Adequate LTSM • Frequent assessment • Schools Characterised by: • Strong accountability • Well managed & organized • Good school discipline • Culture of L & T Labour Market • University/FET • Type of institution (FET or University) • Quality of institution • Type of qualification(diploma, degree etc.) • Field of study (Engineering, Arts etc.) • High productivity jobs and incomes (10%) • Mainly professional, managerial & skilled jobs • Requires graduates, good quality matric or good vocational skills • Historically mainly white High quality secondaryschool Unequal society High SES background High quality primary school Minority (20%) Some motivated, lucky or talented students make the transition • Vocational training • Affirmative action • Big demand for good schools despite fees • Some scholarships/bursaries Majority (80%) • Quality • Type • Attainment Low quality secondary school • Low productivity jobs & incomes • Often manual or low skill jobs • Limited or low quality education • Minimum wage can exceed productivity Low SES background Low quality primary school • Teaching Characterised by: • Low cognitive demand • Slow curriculum coverage • Inadequate LTSM • Weak & infrequent assessment • Weak teacher content knowledge • Schools Characterised by: • Little parental involvement • No accountability • Little discipline • Weak management • High teacher absenteeism
Teaching Characterised by: • High cognitive demand • Full curriculum coverage • Adequate LTSM • Frequent assessment • Schools Characterised by: • Strong accountability • Well managed & organized • Good school discipline • Culture of L & T Labour Market • University/FET • Type of institution (FET or University) • Quality of institution • Type of qualification(diploma, degree etc.) • Field of study (Engineering, Arts etc.) • High productivity jobs and incomes (10%) • Mainly professional, managerial & skilled jobs • Requires graduates, good quality matric or good vocational skills • Historically mainly white High quality secondaryschool Unequal society High SES background High quality primary school Minority (20%) Some motivated, lucky or talented students make the transition • Vocational training • Affirmative action • Big demand for good schools despite fees • Some scholarships/bursaries Majority (80%) • Quality • Type • Attainment Low quality secondary school • Low productivity jobs & incomes • Often manual or low skill jobs • Limited or low quality education • Minimum wage can exceed productivity Low SES background Low quality primary school • Teaching Characterised by: • Low cognitive demand • Slow curriculum coverage • Inadequate LTSM • Weak & infrequent assessment • Weak teacher content knowledge • Schools Characterised by: • Little parental involvement • No accountability • Little discipline • Weak management • High teacher absenteeism
Two school systems not one Ex-department • Grade 4 [2008] • Data: NSES • (Taylor, 2011)
Two school systems not one Language • Grade 5 [2006] • Data: PIRLS • (Shepherd, 2011)
Two school systems not one Socioeconomic Status • Grade 6 [2007] • Data: SACMEQ • (Spaull, 2011)
Grade 3 Numeracy (V-ANA 2011) Correct answer (15cm): 40% of Gr 3 students NB: Test conducted in home language LOLT
Grade 6 Numeracy (V-ANA 2011) Correct answer (90 litres): 32% of Gr 6 students
Matric performance • Matric passes as % of Gr 2 learners 10 years earlier: • 2009: 28% • 2010: 34% • 2011: 38% • In the bottom 4 quintiles of schools, only 1% of learners in grade 8 will go on to pass matric and obtain a C symbol or higher (60%) for Mathematics and slightly fewer for Physical Science • Approximately ten times as many will do so in Quintile 5 schools (Oxford Policy Management & Stellenbosch Economics, 2012)
Source of the problem? • “Low quality education combined with high and lenient grade progression up until grade 11 means that when a standardised assessment occurs, i.e. the Matric examination, this serves to filter a large proportion of weak students out of further attainment. Many of those who do attain a Matric Certificate are still not able to gain entrance into tertiary institutions. Therefore, low-quality education up until grade 11 can be regarded as the root cause of low attainment beyond grade 11.” (Van der Berg et al, 2011: 4) • i.e. the REAL problem is at the primary grades
Student performance 2003-2011 TIMSS (2003) ANA (2011) PIRLS (2006) SACMEQ (2007) TIMSS 2003 (Gr8 Maths & Science) • Out of 50 participating countries (including 6 African countries) SA came last • Only 10% reached low international benchmark • No improvement from TIMSS 1999-TIMSS 2003 PIRLS 2006(Gr 4/5 – Reading) • Out of 45 participating countries SA came last • 87% of gr4 and 78% of Gr 5 learners deemed to be “at serious risk of not learning to read” SACMEQ III 2007(Gr6 – Reading & Maths) • SA came 10/15 for reading and 8/15 for maths behind countries such as Swaziland, Kenya and Tanzania ANA 2011 (Gr 1-6 Reading & Maths) • Mean literacy score gr3: 35% • Mean numeracy score gr3: 28% • Mean literacy score gr6: 28% • Mean numeracy score gr6: 30%
Background: SACMEQ SACMEQ • Southern and Eastern African Consortium for Monitoring Educational Quality • Gr 6 Numeracy • Gr 6 Literacy SACMEQ: South Africa • 9071 Grade 6 students • 1163 Grade 6 teachers • 392 primary schools • See SACMEQ website for research
BasicLiteracy and Numeracy (Gr 6) • What proportion of South African grade 6 children were functionally literate and functionally numerate? • Functionally illiterate: a functionally illiterate learner cannot read a short and simple text and extract meaning. • Functionally innumerate: a functionally innumerate learner cannot translate graphical information into fractions or interpret everyday units of measurement.
SA primary school: Gr6 Literacy – SACMEQ III (2007) Never enrolled 2% Functionally illiterate 25% Basic skills 46% Higher order skills : 27% Forthcoming paper with Stephen Taylor
Grade 6 Literacy SA Gr 6 Literacy Kenya Gr 6 Literacy 1% 5% 7% 25% 49% 46% 39% Public current expenditure per pupil: $258 Public current expenditure per pupil: $1225 Additional resources is not the answer 27%
Grade 6 Literacy $459 $258 $668 $1225 $66
Determinants of low quality? • What are some of the determinants of the low quality education in South Africa? • What do South African teachers know? • Teacher content knowledge • What are the levels of teacher absenteeism? • Time on task and curriculum coverage • What is the distribution of textbooks in SA? • Basic LTSM
Teacher knowledgeSACMEQ III (2007) 401/498 Gr6 Mathematics teachers Correct answer (7km): 38%of Gr 6 Maths teachers 7 2 education systems
Teacher knowledge... Maths teacher content knowledge (SACMEQ III) Source: Stephen Taylor
Accountability: teacher absenteeism(SACMEQ III – 2007 – 996 teachers) 4th/15
Accountability: teacher absenteeism(SACMEQ III – 2007 – 996 teachers) 15th/15
Accountability: teacher absenteeism • Teacher absenteeism is regularly found to be an issue in many studies • 2007: SACMEQ III conducted – 20 days average in 2007 • 2008: Khulisa Consortium audit – HSRC (2010) estimates that 20-24 days of regular instructional time were lost due to leave in 2008 • 2010: “An estimated 20 teaching days per teacher were lost during the 2010 teachers’ strike” (DBE, 2011: 18) • Importantly this does not include time lost where teachers were at school but not teaching scheduled lessons • A recent study observing 58 schools in the North West concluded that “Teachers did not teach 60% of the lessos they were scheduled to teach in North West” (Carnoy & Chisholm et al, 2012)
Accountability: teacher absenteeism(SACMEQ III – 2007 – 996 teachers) Limpopo KwaZulu-Natal Eastern Cape Western Cape % absent > 1 week striking 97% 81% 32% 82% % absent > 1 month(20 days) 48% 62% 22% 73% 12% % absent > 2 months(40 days) 0% 10% 5% 1.3 days a week
Other areas of education? • Spending on education (1994-2011) • Provincial spending on education • Overall spending on education • Access to education • Recent improvements • ANA’s • Workbooks
Spending 1994 (Fiske & Ladd, 2004: 104)
Spending 2000 (Fiske & Ladd, 2004: 104)
Spending 2000-2011 Spending on public ordinary schools per public school per learner by province in 2001/2 and 2010/11 (Oxford Policy Management & Stellenbosch Economics, 2012)
Expenditure on education2010/11 Total government expenditure (31% GDP in 2010/11 – R733.5bn) Government expon education (19.5% of Gov exp: R143.1bn) 17% 5%
Expenditure Post-apartheid government has equalised government expenditures across provinces and has adopted pro-poor public spending
Access • Percentage of learners enrolled in grade 1 who attended a pre-primary programme increased from 61% in 2006 to 71% in 2009 • At least 99% of children enter formal schooling and only a few drop out in primary school. • In the last ten years the proportion of youths attaining grade 9 has risen from 76% to 86%.
Access Post-apartheid government has expanded the education system with almost universal coverage in the primary and early secondary grades.
Quality Quality of education and educational outcomes are very low and highly unequal
2 Significant improvements (2010/11) • Annual National Assessments • 2 main aims are (1) accountability, and (2) support • Provide comparable information on student learning & school performance • Provide benchmarks for grade-appropriate assessment • Support can be targeted to specific schools, teachers and learners • Workbooks • A workbook for every child for maths and language • High quality learning/teaching resources • Helps teacher pace learning & cover curriculum • 4 worksheets/term ; 8 weeks/term ; 2 terms per volume (4 workbooks per year – 2 for maths and 2 for language
Grade 4 – Genre – Time table Source: Veronica McKay
Grade 1 – Isixhosa Source: Veronica McKay
State of SA education since transition “Although 99.7% of South African children are in school…the outcomes in education are abysmal” (Manuel, 2011) “Without ambiguity or the possibility of misinterpretation, the pieces together reveal the predicament of South African primary education” (Fleisch, 2008: 2) “Our researchers found that what students know and can do is dismal” (Taylor & Vinjevold, 1999) “It is not an overstatement to say that South African education is in crisis.” (Van der Berg & Spaull, 2011)
Scorecard • Equalize expenditure • Expand access • Improve quality/outcomes
Conclusions • Equalizing resources has not equalized outcomes • South Africa performs worse than many poorer African countries • Failure to get the basics right – large numbers of students are failing to acquire BASIC numeracy and literacy skills Serious blight on the national conscience Persistent patterns of poverty and privilege
3 biggestchallenges - SA • Failure to get the basics right • Children who cannot read, write and compute properly (Functionally illiterate/innumerate) after 6 years of formal full-time schooling • Often teachers lack even the most basic knowledge • Equity in education • 2 education systems – dysfunctional system operates at bottom of African countries, functional system operates at bottom of developed countries. • More resources is NOT the silver bullet – we are not using existing resources • Lack of accountability • Little accountability to parents in majority of school system • Little accountability between teachers and Department • Teacher unions abusing power and acting unprofessionally
Way forward? • Acknowledge the extent of the problem • Low quality education is one of the three largest crises facing our country (along with HIV/AIDS and unemployment). Need the political will and public support for widespread reform. • Focus on the basics • Every child MUST master the basics of foundational numeracy and literacy these are the building blocks of further education – weak foundations = recipe for disaster • Teachers need to be in school teaching (re-introduce inspectorate?) • Every teacher needs a minimum competency (basic) in the subjects they teach • Every child (teacher) needs access to adequate learning (teaching) materials • Use every school day and every school period – maximise instructional time • Increase information, accountability & transparency • At ALL levels – DBE, district, school, classroom, learner • Strengthen ANA • Set realistic goals for improvement and hold people accountable
Education “Education is the great engine of personal development. It is through education that the daughter of a peasant can become a doctor, that the son of a mineworker can become the head of the mine, that a child of farm-workers can become the president” – Nelson Mandela If we looked at 200 Grade 1 children 12 years ago and then look at them again in matric, only 1 out of the 200 were eligible for a maths or science degree based on their matric marks – the correspodning figure for white children was 15 times higher.
References • Fleisch, B. (2008). Primary Education in Crisis: Why South African schoolchildren underachieve in reading and mathematics. Cape Town. : Juta & Co. • Hoadley, U. (2010). What doe we know about teaching and learning in primary schools in South Africa? A review of the classroom-based research literature. Report for the Grade 3 Improvement project of the University of Stellenbosch. Western Cape Education Department. • Hungi, N., Makuwa, D., Ross, K., Saito, M., Dolata, S., van Capelle, F., et al. (2011). SACMEQ III Project Results: Levels and Trends in School Resources among SACMEQ School Systems. Paris: Southern and Eastern Africa Consortium for Monitoring Educational Quality. • Ross, K., Saito, M., Dolata, S., Ikeda, M., Zuze, L., Murimba, S., et al. (2005). The Conduct of the SACMEQ III Project. In E. Onsomu, J. Nzomo, & C. Obiero, The SACMEQ II Project in Kenya: A Study of the Conditions of Schooling and the Quality of Education. Harare: SACMEQ. • Shepherd, D. (2011). Constraints to School Effectiveness: What prevents poor schools from delivering results? Stellenbosch Economic Working Papers 05/11. [PIRLS] • Spaull, N. (2011a). A Preliminary Analysis of SACMEQ III South Africa.Stellenbosch Economic Working Papers. • Spaull, N. (2011). Primary School Performance in Botswana, Mozambique, Namibia and South Africa. Paris: Southern and Eastern African Consortium for Monitoring Educational Quality (SACMEQ) Working Paper no.8. • Spaull, N. 2012Equity & Efficiency in South African primary schools : a preliminary analysis of SACMEQ III South Africa Masters Thesis. Economics. Stellenbosch University • Taylor, S. (2011). Uncovering indicators of effective school management in South Africa using the National School Effectiveness Study.Stellenbosch Economic Working Papers 10/11, 1-51. [NSES] • Van der Berg, S., Burger, C., Burger, R., de Vos, M., du Rand, G., Gustafsson, M., Shepherd, D., Spaull, N., Taylor, S., van Broekhuizen, H., and von Fintel, D. (2011). Low quality education as a poverty trap. Stellenbosch: University of Stellenbosch, Department of Economics. Research report for the PSPPD project for Presidency.
Thank you www.nicspaull.com/research nicholasspaull@gmail.com @NicSpaull