Download
1 / 9
90 likes | 193 Vues
Estimating Free Energy in AR 8210. Acknowledgements Graham Barnes ( Colarado Research Associates, NWRA ) Ravi Belur ( Dept. of Physics, Montana State Univ ) Colin Beveridge ( Dept. of Physics, MSU ) K. D. Leka ( Colarado Research Associates, NWRA ) Dana Longcope ( Dept. of Physics, MSU )

E N D
Estimating Free Energy in AR 8210 Acknowledgements Graham Barnes (Colarado Research Associates, NWRA) Ravi Belur (Dept. of Physics, Montana State Univ) Colin Beveridge (Dept. of Physics, MSU) K. D. Leka (Colarado Research Associates, NWRA) Dana Longcope (Dept. of Physics, MSU) Jim McTiernan (Space Sciences Lab, UC Berkeley) Tom Metcalf (Colarado Research Associates, NWRA) Blame Brian Welsch (Space Sciences Lab, UC Berkeley)
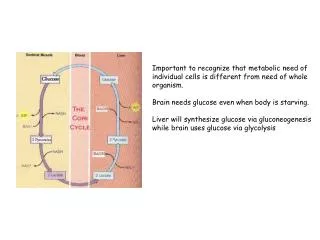
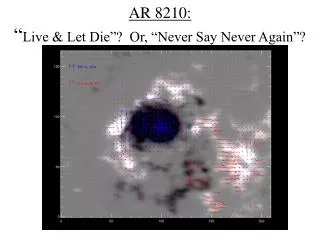
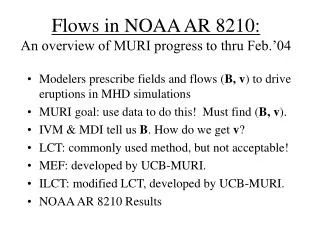
The central question we hope to address is: Can we accurately estimate free energy in AR 8210? AR 8210 is rare for its long-duration set of high-quality vector magnetograms near the time of a CME. We hope that new vector magnetographs – SOLIS/VSM, Solar-B/FPP, and SDO/HMI – should give us many more such data sets. Acknowledgement (again): K.D. Leka worked hard to reduce & average the IVM magnetograms for our analyses.
The data are 21 vector m’grams with ~20 min. cadence, averaged from 5 consecutive m’grams with ~4 min. cadence.
Approach: Compare free energy estimates from several methods, study consistency or lack thereof. • Nonlinear Force-free Field Extrapolation, Jim McTiernan (~15 min.) • (Modified) Magnetic Virial Theorem, Tom Metcalf (~15 min.) • >> Break (~30 min.) << • Minimum Current Corona Model, Graham Barnes, Colin Beveridge, Dana Longcope (~20 min.) • Free Energy Flux, Brian Welsch & Ravi Belur (remaining)
GOES data & other estimates of coronal energy losses provide a measure of “ground truth.” +’s are flares NOAA ascribed to AR 8210 ’s are thermal energies from GOES, at flare peak ’s are kinetic energies from halo CMEs from CDAW list: http://cdaw.gsfc.nasa.gov/CME_list/ solid curve is cumulative radiative loss from GOES (neglects conductive loss) dotted curve is heating rate from Pevtsov et al., ApJL 598 (2003), with = 1022 Mx Plot courtesy D. Longcope
Regnier & Canfield (A&A, v. 451, p. 319) also studied magnetic energy changes in AR 8210.
After reading Emslie et al. JGR 109, A10104 (2004) I realized there might be a few other elements capable of providing a ground-truth for energetics. The attached plot works as follows: top panel: GOES as before, +s denote 4 large flares IDed by NOAA as originating in 8210 bottom: energies of various kinds (key at top). these are accumulated beginning *after* the M6.8 flare on April-28. the different quantities are: Uth (squares) use GOES to calculate the total thermal energy in the flare plasma, at its peak. I've made guesses for the flare plasma volume in each flare. Halo CMEs (diamonds): this is the kinetic energy reported on http://cdaw.gsfc.nasa.gov/CME_list/ I expect there to be an interesting discussion on the relevance of this energy to free-energy content of the AR. Radiation: this is the same thing i plotted before, but now the integration is begun after the decay of the M6.8 flare. It is the *total* radiative losses for the plasma observed by GOES. If you assume the plasma cools in equal measures from radiation and condution then the actual losses would be twice this large. Heating: this is the BG radiation loss rate reported in Pevtsov et al. ApJL 598 (2003) w/ Phi=1.0e22 Mx. It is intended as a kind of lower bound. Longcope’s Plot Caption