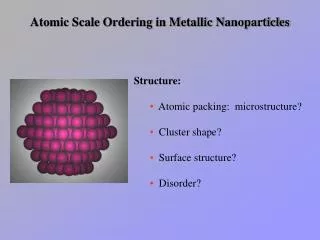
Atomic Scale Ordering in Metallic Nanoparticles
Atomic Scale Ordering in Metallic Nanoparticles. Structure: Atomic packing: microstructure? Cluster shape? Surface structure? Disorder?. Characterization. Electron Microscopy Scanning Transmission Electron Microscopy (STEM) Electron Diffraction

Atomic Scale Ordering in Metallic Nanoparticles
E N D
Presentation Transcript
Atomic Scale Ordering in Metallic Nanoparticles • Structure: • Atomic packing: microstructure? • Cluster shape? • Surface structure? • Disorder?
Characterization • Electron Microscopy • Scanning Transmission Electron Microscopy (STEM) • Electron Diffraction • X-ray Absorption Spectroscopy • X-ray Absorption Near Edge Spectroscopy (XANES) • Provides information on chemical states • Oxidation state • Density of states • Extended X-ray Absorption Fine Structure (EXAFS) • Provides local (~10 Å) structural parameters • Nearest Neighbors (coordination numbers) • Bond distances • Disorder
(111) (001) (110) Face Centered Cubic Structure
[011] [112] [310] Electron Microdiffraction Electron diffraction probes the ordered microstructure of the nanoparticles. Above are 3 sample diffraction patterns for ~ 20 Å Pt nanoparticles. All are indexed as face-centered cubic (fcc).
Absorption Photon Energy X-Ray Absorption Spectroscopy • Absorption coefficient (m) vs. incident photon energy • The photoelectric absorption decreases with increasing energy • “Jumps” correspond to excitation of core electrons Adapted from Teo, B. K. EXAFS: Basic Principles and Data Analysis; Springer-Verlag: New York, 1986.
Pt L3 edge (11564 eV) Pt foil I0 IT EXAFS x Extended X-ray Absorption Fine Structure • oscillation of the X-ray absorption coefficient near and edge • local (<10 Å) structure surrounding the absorbing atom
hn e- Ri PE = hn - E0 E0 initial final • Excitation of a photoelectron with wavenumber k = 2p/l • Oscillations, ci(k): final state interference between outgoing and backscattered photoelectron Ri - distance to shell-i Ai(k) - backscattering amp. Basics of EXAFS
Data Analysis m Convert to wave number m0 m0(0) Subtract background and normalize Resulting data is the sum of scattering from all shells
R 1 Pt L3 edge, Pt foil ) -3 (r)|(Å R c 3 | R R 4 2 r (Å) Fourier Transform Resolve the scattering from each distance (Ri) into r-space
Multiple-Shell Fit Calculate Fi(k) and di(k) for each shell-i (i = 1 to 6) using the FEFF computer code Non-linear least-square refinement: vary Ni, Ri, s2i using the EXAFS equation
SS1 TR2 DS SS4 TS SS2 SS3 TR1 SS5 TR3 In-plane atom Above-plane atom Absorbing atom Multiple Scattering Paths
X-Ray Absorption Near Edge Spectroscopy (XANES) XANES measurements for reduced 10%, 40% Pt/C, 60% Pt/C Pt/C, and Pt foil at 200, 300, 473 and 673 K. A total of 16 measurements are shown. All overlay well with bulk Pt (Pt foil); therefore, the samples are reduced to their metallic state.
Size Dependence Size dependence on the extended x-ray absorption spectra. The amplitude of the EXAFS signal is directly proportional to the coordination numbers for each shell; therefore, as the cluster size increases, the amplitude also will increase.
Multiple Shell Fitting Analysis 40% Pt/C 10% Pt/C
Temperature Dependence Temperature dependence on the extended x-ray absorption spectra for 10% Pt/C. As the temperature increases, the dynamic disorder (D2) increases, causing the amplitude to decrease.
First Shell Fitting: 10% Pt/C 200 K 300 K 673 K 473 K
The EXAFS Disorder, s2, is the sum of the static, ss2, and dynamic, sd2, disorder as follows: The dynamic disorder, sd2, can be separated by using the following relationship: Size Dependent Scaling of Bond Length and Disorder
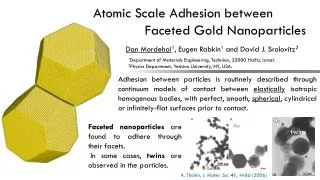
Structure and Morphology Hemispherical cuboctahedron, (111) basal plane • Determining shape and texture • Electron microscopy • X-Ray absorption spectroscopy • Molecular modeling Hemispherical cuboctahedron, (001) basal plane Spherical cuboctahedron
Theoretical vs. Experimental Spherical Hemispherical
Molecular Modeling: Understanding Disorder • Probe bulk vs. surface relaxation. • Bulk: • Allow relaxation of entire structure. • Surface: • Allow relaxation of atoms bound in surface sites only.
Surface Relaxation Bulk Relaxation • Theoretical: • <d1NN> = 2.74 Å • 2 = 0.0022 Å2 • Experimental: • <d1NN> = 2.753(4) Å • 2 = 0.0017(2) Å2 • Theoretical: • <d1NN> = 2.706 Å • 2 = 0.0003 Å2 • Experimental: • <d1NN> = 2.753(4) Å • 2 = 0.0017(2) Å2 Bond Length Distributions: 10% Pt/C <d1NN>BULK= 2.77 Å <d1NN>FOIL= 2.761(2) Å
Bulk Relaxation Surface Relaxation • Theoretical: • <d1NN> = 2.689 Å • 2 = 0.0002 Å2 • Experimental: • <d1NN> = 2.761(7) Å • 2 = 0.0010(2) Å2 • Theoretical: • <d1NN> = 2.76 Å • 2 = 0.0013 Å2 • Experimental: • <d1NN> = 2.761(7) Å • 2 = 0.0010(2) Å2 Bond Length Distributions: 40% Pt/C <d1NN>BULK= 2.77 Å <d1NN>FOIL= 2.761(2) Å
Future Directions • In-depth modeling of relaxation phenomena. • Further understanding the “nano-phase” behavior of bimetallic • particles. • Polymer matrices as supports and stabilizers for nanoparticles. • Silanes • Hydrogels
Acknowledgments Dr. Ralph Nuzzo Dr. Andy Gewirth Dr. Tom Rauchfuss Dr. John Shapley Dr. Anatoly Frenkel Dr. Michael Nashner Dr. Ray Twesten Dr. Rick Haasch Nuzzo Research Group Funding: Department of Energy Office of Naval Research