Download
1 / 29
290 likes | 435 Vues
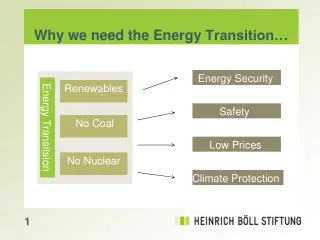
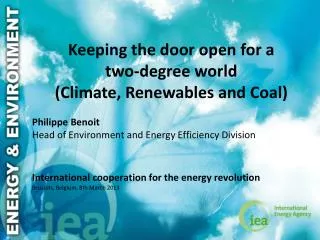
Keeping the door open for a two-degree world (Climate, Renewables and Coal) Philippe Benoit Head of Environment and Energy Efficiency Division International cooperation for the energy revolution Brussels, Belgium, 8th March 2013. Table of contents.

E N D
Keeping the door open for a two-degree world (Climate, Renewables and Coal) Philippe Benoit Head of Environment and Energy Efficiency Division International cooperation for the energy revolution Brussels, Belgium, 8th March 2013
Table of contents • From Climate Change to Energy Emissions • Getting energy emissions to 2 C: Role for Renewables • Tools to promote renewables • Need to address fossil fuels o
From Climate Change to Energy Emissions A Change in global temperatures . . . Source: (IPCC, 2007)
From Climate Change to Energy Emissions A Result from different GHG concentrations... ~ 4 C ~ 6 C ~ 2 C Source: WEO, 2012
From Climate Change to Energy Emissions A Result from different emissions profiles. ~ 6 C ~ 4 C ~ 2 C Source: WEO, 2010
From Climate Change to Energy Emissions A Gt CO2 Energy sector is a key driver as it represents over 60% of human generated emissions... Total anthropogenic emissions Global energy emissions
Table of contents From Climate Change to Energy Emissions Getting energy emissions to 2 C: Role for Renewables Tools to promote renewables Need to address fossil fuels Conclusions o
Lowering energy emissions B Gt CO2 o 4 C OECD Non-OECD renewables 29% 15 Gt efficiency 70% nuclear o 2 C biofuels CCS 2035 Source: WEO 2012 4DS Global energy emissions 2DS
Role of renewables in electricity generation B Annual electricity generation by technology TWh 2DS > 55% > 45% Renewables Nuclear Fossil Renewables need to supply > 45% of the generation by 2035 and > 55% by 2050 in 2DS Source: ETP, 2012
Table of contents From Climate Change to Energy Emissions Getting energy emissions to 2 C: Role for Renewables Tools to promote renewables Need to address fossil fuels Conclusions o
Continuing Policy Support: Necessary and Justified C • Policies need to continue to deliver energy security, environmental and economic benefits • Need for economic incentives • RE technologies not yet generally cost competitive under current pricing mechanisms (e.g. lack of global carbon pricing) • Transitional support needed to stimulate learning and cost reduction and bring a larger portfolio of RET to competitiveness • Address non-economic barriers that hamper deployment • Access to market and administrative hurdles • Access to finance • Infrastructure barriers • Lack of awareness and skilled personnel • Public acceptance and environmental barriers • Policies need to have highest impact at lowest costs
Policy Types • Information and education • Policy Development support • Institutional capacity • Strategic planning • Regulatory instruments • Auditing • Monitoring • Obligation schemes (RPS) • RD&D • Economic Instruments • Direct investments • Infrastructure investments • RD&D funding • Fiscal / financial incentives • Feed-in Tariffs • Grants and subsidies • Loans • Guarantees • Tax reliefs • User charges • Market – based instruments • Emission allowances • Green certificates
Overarching Best-Practice Policy Principles C • Predictable RE policy framework, integrated into overall energy strategy • Portfolio of incentives based on technology and market maturity • Dynamic policy approach based on monitoring of national and global market trends • Tackle non-economic barriers • Address system integration issues
‘Diff. Horses for Diff. Courses’ C • Hydro vs. Wind vs. Solar vs. Biomass • Underlying economics (grid-parity vs. subsidized) • Hydro • On-shore wind • Off-shore wind • Solar • Power vs. Transport vs. Industry • Structure of Economy • Role of Private Sector • Role of Public Sector • Role of state-owned enterprises
Different Strokes for Different Investors RENEWABLES Private Sector State-Owned Enterprises
IEA medium-term projections C Continued growth . . . MTMR projections
Emerging Role for Emerging Economies C • China becomes deployment leader • OECD Europe deployment growth slows • OECD Americas growth tied to US policy uncertainties
Challenges to Growth C • Challenges of scale: • Large scale renewables require different transmission lines (e.g., lines to remote sites) • Requires different power system management (integration of variable renewables) • Missed synergies of national vs. multi-country • site optimization vs. national based preferences • Interconnectors: Regional Integration • Rising Electricity Prices and share of renewables and . . .
Challenges to Growth C • Policy Uncertainties
Table of contents • From Climate Change to Energy Emissions • Getting energy emissions to 2 C: Role for Renewables • Tools to promote renewables • Need to address fossil fuels • Conclusions o
Role of Renewables vs. Fossil Fuels D o 4 C Fossil Fuels Renewables o 2 C 2035
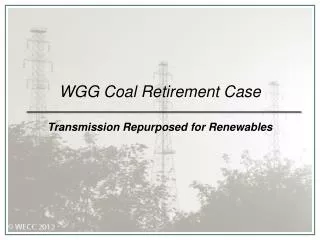
Role of Renewables vs. Fossil Fuels D o 4 C RENEWABLES 420 GW installed between 2000 and 2011 COAL 716 GW installed between 2000 and 2011 o 2 C 2035
“Lock-In” of 2 degree Emissions D 35 Gt 30 Other 2 °C trajectory 25 Transport 20 Room to manoeuvre Room to manoeuvre Industry 15 10 Lock-in of existing infrastructure 5 Power generation 2011 2015 2020 2025 2030 2035
“Lock-In” of 2 degree Emissions D Planned fossil fuel production through 2017 will generate all energy emissions under 2DS through 2035 2017 35 Gt 30 Other 2 °C trajectory 25 Transport 20 Room to manoeuvre Industry 15 10 Lock-in of existing infrastructure 5 Power generation 2011 2015 2020 2025 2030 2035
‘Un-locking’ strategies D • “Early retirement” (decommissioning) • Fuel switching (changing dispatch rather than energy mix) • Carbon Capture and Storage • Remove fossil fuel subsidies Keys to ‘un-lock’ energy emissions include:
‘Un-locking’ Policies D Possible Policy tools to unlock: • Market mechanisms • ETS • Carbon taxing • Mandates – portfolio prescriptions /restrictions • Policy directives (e.g. to state-owned enterprises) • Influencing relative pricing
Conclusions E • Renewables remain the key to a green future • and they still require policy attention for scaling up • But if we don’t address fossil fuel emissions, the 2-degree door will close • Policies need both to promote renewables and un-lock fossil fuel emissions to achieve a 2-degree future • Political Will/Motivation are key
Thank you philippe.benoit@iea.org