1 / 1

טבלה 1: הדמוגרפיה של הקבוצות RDI RDI - NON

טבלה 1: הדמוגרפיה של הקבוצות RDI RDI - NON גיל בחודשים ממוצע 60.44 71.93 סטיית תקן 19.16 35.44 מרווח בין ה- ADOS ממוצע 14.62 10.92

fawzi
Télécharger la présentation

טבלה 1: הדמוגרפיה של הקבוצות RDI RDI - NON

An Image/Link below is provided (as is) to download presentation Download Policy: Content on the Website is provided to you AS IS for your information and personal use and may not be sold / licensed / shared on other websites without getting consent from its author. Content is provided to you AS IS for your information and personal use only. Download presentation by click this link. While downloading, if for some reason you are not able to download a presentation, the publisher may have deleted the file from their server. During download, if you can't get a presentation, the file might be deleted by the publisher.

E N D

Presentation Transcript


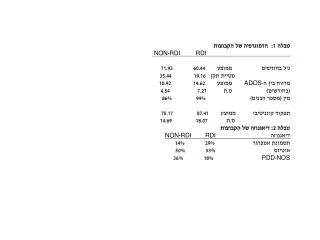
  1. טבלה 1: הדמוגרפיה של הקבוצות RDIRDI- NON גיל בחודשים ממוצע 60.44 71.93 סטיית תקן 19.16 35.44 מרווח בין ה-ADOS ממוצע 14.62 10.92 (בחודשים) ס.ת 7.27 4.54 מין (מספר הבנים) 94% 86% תפקוד קוגניטיבי ממוצע 87.41 75.17 ס.ת 18.07 14.69 טבלה 2: דיאגנוזה של הקבוצות דיאגנוזה RDIRDI-NON תסמונת אספרגר 29% 14% אוטיזם 53% 50% NOS-PDD 18% 36%

More Related