Download
1 / 72
790 likes | 1.31k Vues
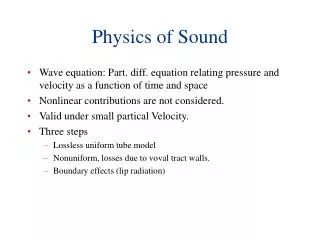
PHYSICS of SOUND Grade11. With CRO and Signal Generator. C.M. Bali, BSc (Hons) MSc MEd Teacher Dept of Mathematics and Science (Physics) Miles Macdonell Collegiate, Winnipeg. Grade 11Physics Outcomes for Sound. S3P-1-17 : How sounds are produced, transmitted and detected

E N D
PHYSICS of SOUNDGrade11 With CRO and Signal Generator C.M. Bali,BSc (Hons) MSc MEd Teacher Dept of Mathematics and Science (Physics) Miles Macdonell Collegiate, Winnipeg C.M. Bali
Grade 11Physics Outcomes for Sound • S3P-1-17: How sounds are produced, transmitted and detected • S3P-1-18: Analyze an environmental issue concerning sound • S3P-1-19: Design, construct, test, and demonstrate technological devices to produce, transmit, and or control sound waves for useful purposes • S3P-1-20:Intereference of sound waves. • for resonance • S3P-1-22: Speed of sound in air • S3P-1-23: Effect of temperature and other factors (including materials) on the speed of sound. • S3P-1-24: Doppler Effect (Qualitative treatment) • S3P-1-25: Decibel scale (Qualitative, example of sound) • S3P-1-26: Applications of sound waves (hearing aid (for Mr. Bali), ultrasound, stethoscope, cochlear implants (also perhaps for Mr. Bali)) • S3P-1-28:Examine the octave in a diatonic scale in terms of frequency relationships and major triads. C.M. Bali
Cathode-ray Oscilloscope (CRO)or oscilloscope for short C.M. Bali
Sound of Music(You can even play the game ‘Guess that Tune’) Some musical instruments and their characteristic sound Click on the link below Choose the instrument Click play • http://www.dsokids.com/2001/instrumentchart.htm • As you play a tune, you should display the sound pattern on the CRO. S3P1-17 C.M. Bali
Experiments with CROand signal generator • Frequency of a tuning fork (Slide 9) • Experiment to explore frequency, amplitude, pitch, intensity and loudness of Sound (Slide15) • Comparing loudness at different distances (Slide 18) • Beat Frequency (Slide 21) • Speed of sound using progressive waves (Slide 30) • Speed of sound using stationary waves (Slides 42 and 43) • Standing waves on strings. Speed of waves on strings (Slide 45) • Quality (timbre) (Slide 47) • How to show the velocity of a wave depends on tension and mass per unit length of string. (Slide 49) • Resonance (Slides 59) • Resonance (Slide 62) • Demonstration of phase and measurement of speed of sound (68) • Variation of intensity of sound with distance (Question) (Slide 70) C.M. Bali
The function of oscilloscope The basic function of an oscilloscope is to plot a graph of Voltage versus time C.M. Bali
Voltage versus time Timebase Ch 1Y amplifier Y AMPLIFIER: 2V/cm TIMEBASE, t : 5ms/cm 2cm*2v/cm = 2 volts Voltage (Y) Time (X) 2cm*5ms/cm=10 ms =0.010 s = period 1cm*5ms/cm =0.005 s C.M. Bali
SOUND: The maximum range of human hearing includes sound of Frequencies 15-18,000 Hz (Microsoft Encarta Encyclopedia. CD-ROM. 2000) C.M. Bali
Measurement of frequency of a tuning fork See next slide for details Time base To CH 1 Microphone Preamplifier Storage / Analogue switch Save All switch S3P1-17 S3p1-19 C.M. Bali
Measurement of the frequency of a tuning fork • Connect the apparatus as in the previous slide. All switches should be in the up position. • Turn oscilloscope on. Adjust the intensity and focus control. • Timebase should be calibrated (Turn ‘Var Sweep’ clockwise). • Strike the tuning fork and hold the prongs close to the mike. • Turn the time base switch until a good, well spaced, fairly stable sine signal is obtained. • Press Storage / analogue switch in.Freeze the trace by pressing in the Save All button. • Measure peak to peak horizontal distance and multiply it by time base scale. • Frequency = 1 / period (Hz) • Before repeating, press out Storage/analogue. C.M. Bali
Tuning Fork Observations C.M. Bali
% Error% uncertainty C.M. Bali
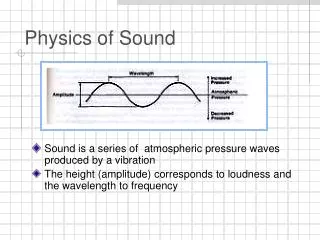
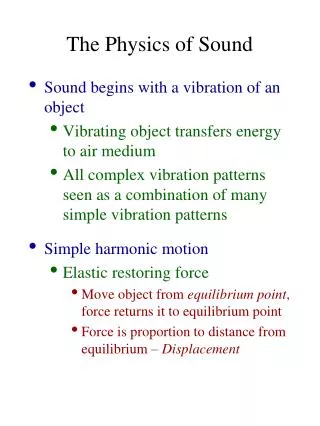
Sound: Longitudinal Mechanical Waves • Sound is a longitudinal wave, but they are drawn as transverse waves, to make the information clear. Sound is a mechanical wave as it requires a material medium such as air or metal or any other material for its transmission as well as a source of energy that disturbs the material medium. • Click on the link below to see longitudinal and transverse waves. Pay attention to the source of disturbance and the material medium that transmits the disturbance.. • Focus on any one particle (a black dot) of gas to see its to and fro movement in the direction of the flow of the wave’s energy: in this picture sound wave progresses horizontally to the right. • http://www.kettering.edu/~drussell/Demos/waves/wavemotion.html C.M. Bali
Sound Characteristics Frequency Amplitude Pitch Intensity Loudness Quality or Timbre C.M. Bali
Experiment to explorefrequency, amplitude, pitch, intensity and loudness of Sound Frequency display Time base Frequency dial Signal Generator Amplitude dial Speaker To CH 1 Microphone Preamplifier Constant distance See next slide for details D S3P-1-19,1-27 C.M. Bali
Frequency and Pitch • Set up the experiment as in the previous slide (15). • Turn on the oscilloscope and the signal generator. • Investigate the pitch by listening to the sound from the speaker as the frequency is increased and then decreased. Keep amplitude (peak to peak distance on the oscilloscope) and D constant. • Students should see that the higher the frequency the higher the pitch. • (You can do this by using tuning forks of various frequencies, but it is difficult to keep the amplitudes constant) S3P-1-27 C.M. Bali
Intensity and loudness of Sound • See slide # 10 for experimental set up. • Intensity = power per m2 (W m – 2) • Power is proportional to the square of the amplitude of the wave. (Follows from SHM) • Amplitude of the CRO trace is proportional to the amplitude of the sound wave hitting the microphone. • Thus intensity of sound is proportional (not equal) to the square of the amplitude of the CRO trace. [CRO measures voltage] • Loudness: S3P-1-27 C.M. Bali
Comparing loudness at different distances • Set up the experiment as shown below (also see slide 10). • Place microphone 50 cm from the speaker and adjust the volume on the signal generator to get a CRO trace of 1 cm amplitude. • Move the microphone by 20 cm at a time towards and away from the speaker. Find the dB level of the sound relative to the reference point. Signal generator Microphone Speaker 0 cm 50 cm 100cm S3P-1-27 C.M. Bali
Double Beam OscilloscopeIt has two inputs CH1 CH2 and a common timebaseTherefore, you can display and compare two signals (graphs) simultaneously. C.M. Bali
Beat Phenomenon When two sound waves of different frequencies interfere we hear sound whose amplitude varies periodically. C.M. Bali
How to show beat phenomenon and measure beat frequency Measure Beat period Bt freq = 1 / Bt period Ch1, Ch2, Dual, Add SWITCH Ch1,Ch2, Dual, Add SWITCH Timebase See slide 26 for details Storage / analogue switch Beat period Store All switch To CH1 To Ch 2 To red and black terminals To Red and Black terminals Signal Gen 1 Signal Gen 2 499Hz 510Hz Speaker 1 Speaker 2 Outcomes SP3-1-17 Sp3-1-19 S3P-1-20 C.M. Bali
Measurement of beat frequency When two sinusoidal functions of different frequencies are added we get: Displacement Tb Time C.M. Bali
Beat Frequency FormulaIf two sinusoidal disturbances, y1 and y2, of frequencies, f1 and f2, are added, the principle of superposition gives: Not for grade 11students but suitable for grade 12 C.M. Bali
Beat Frequency Formula: A simple approach using relative speed • Imagine two athletes, A and B, running to and fro on a straight track, a total distance of 2L. • Suppose A takes x seconds and B takes y seconds to complete one to and fro distance on the track . • Therefore, x and y are the periods of A and B • Frequency of A =1/x, and of B= 1/y • Let us assume they will be running for some time! • We want to know how often they meet or cross each other. To be more precise, how many times per second they will cross each other; that is, what is their beat frequency? Students should be able to do this proof SP3-1-20 C.M. Bali
Beat Frequency Formula: A simple approach using relative angular speed (in degrees) Students should be able to do this proof • Imagine two athletes, A and B, running around a circular track. • Suppose A takes x seconds and B takes y seconds to go round the track once. • Therefore, x and y are the periods of A and B • Frequency of A =1/x, and of B= 1/y • Let us assume they will be running for some time! • We want to know how often they cross each other. To be more precise, how many times per second they will cross each other; that is, what is their beat frequency? • You can go through this argument using radians, and will get the same result. C.M. Bali
Measurement of Beat frequencyExperimental Procedure • Set up the experiment as in slide 21. • Set Signal 1 to 490 Hz, and Signal 2 to 509 Hz. You should hear beating sound. • Set Oscilloscope to: Dual, time base to 20ms/Div, Storage/ analogue switch in, andY1 and Y2 to an appropriate scale. You should see two traces somewhat out of phase. • Now press the Add switch. • With the storage / analogue switch in, PressStore All switch. • This should freeze the trace. • Measure Beat period. 8. Calculate Beat frequency. C.M. Bali
Beat Frequency Observations C.M. Bali
Sound as Progressive waveA simple argument for students • Progressive waves carry energy from one point to another. • As the wave particle oscillates once, the wave moves forward by one wavelength. • If the particles oscillates f times per second, the wave will move forward f wavelengths. • Thus: C.M. Bali
Speed = frequency * wavelengthA more rigorous derivation Not for students C.M. Bali
Measurement of speed of soundusing progressive waves See slide 32 for details Timebase Double beam Frequency can be read Directly from Signal generator Or from the oscilloscope trace A = Signal generator B = Speaker C = Mini Microphone D = Block of wood for support E = Preamplifier F = Mitre rule To Ch2 To Ch1 input E Dual mode A B C F D 100 cm 0cm Note this reading when both signals are in Phase Move D until both signals are in phase again. Note this point S3P- 1-17, 1-19, 1-22 This distance, d = One wavelength C.M. Bali
Measurement of speed of soundUsing progressive waves • Set up the experiment as shown on the previous slide • We know from basic experiments that speed of sound is about 340 m / s. • We want to measure a wavelength of say 20 cm. This informs us that the frequency should be around 340 / 0.20 = 1700 Hz. • We will use the frequency of sound at 1.5 KHz to 3.0 kHz. C.M. Bali
Errors and uncertainties Students can calculate errors and uncertainties in the beat frequencies from data in previous slide C.M. Bali
How to calculate uncertainties C.M. Bali
Calculating Uncertainties • Sig. Gen freq Frequency from CRO Wavelength Speed using CRO freq • 1500 Hz 1470 Hz (34.0 -10.0) =2 4. 0 cm 0.24*1470 = 3 50 m / s C.M. Bali
Theory of UncertaintiesErrors always add, hence absolute signs. Not for students C.M. Bali
Uncertainties A measurement can never be perfect. Theminimum error in a measurement is equal to the instrumental error. If the variation in the measurement is much bigger than the instrumental error, then ignore the instrumental error, but use the deviation or standard deviation from the mean as a measure of uncertainty in the mean. C.M. Bali
Example C.M. Bali
Conditions for setting upStationary Waves When two progressive waves of the same frequency and wavelength And traveling in opposite directions And interfere then, at certain wavelengths, that satisfy the boundary conditions, Stationary waves are formed. C.M. Bali
Mathematics of Stationary Waves Not for grade 11 students C.M. Bali
Standing wavesFrom the University of Toronto http://www.upscale.utoronto.ca/GeneralInterest/Harrison/Flash/#sound_waves • http://faraday.physics.utoronto.ca/IYearLab/Intros/StandingWaves/Flash/reflect.html • http://faraday.physics.utoronto.ca/IYearLab/Intros/StandingWaves/Flash/standwave.html • http://faraday.physics.utoronto.ca/IYearLab/Intros/StandingWaves/Flash/sta2fix.html • http://faraday.physics.utoronto.ca/IYearLab/Intros/StandingWaves/Flash/sta1fix.html C.M. Bali
Speed of soundusing stationary waves See next slide for details Speaker signal Signal Generator Amplitude dial Microphone signal (White dotted line): almost flat showing a node position at microphone Shiny reflector Dual Mode Speaker Microphone CH 1 CH 2 S3P-1-19,1-27 C.M. Bali
Speed of sound using Stationary Waves • Set up the experiment as in the previous slide (slide 42) • Move the screen until the microphone signal is very small (see slide 45 for analogy). • Now keep the screen still, and move the microphone gently. • Measure the distance between two nodal points: this is equal to the distance moved by the microphone between two successive points where the CRO signal is very small, while the reflector is kept at the same position. This distance is equal to half the wavelength. Thus, the wavelength is twice this distance. • Find speed of sound by multiplying the wavelength by the frequency, which can be seen on the signal generator. • Find uncertainty in the speed. • Find error in the speed. C.M. Bali
Natural Frequencies and Resonance All objects have certain natural frequencies of oscillations. For example, a swing can oscillate back and forth at a certain frequency that depends on its dimensions. If you push this swing gently but periodically, such that the frequency of your push is exactly the same as the natural frequency of the swing, then energy can flow from the your body into the swing. The energy in the swing can build up to the extent that the swing may become very unstable (very high amplitude of vibration) and even break !! Three dimensional objects have many natural frequencies of vibrations. Show: Tacoma Narrows Bridge Falls http://www.boreme.com/boreme/funny-2007/tacoma-bridge-p1.php The phenomenon in which energy can pass easily from one object (A) into an other (B) if it is fed at the natural frequency of the other (B) object is called resonance. SEE NEXT SLIDE: C.M. Bali
How to set up a stationary (resonating) wave on a string AN 1st Harmonic N N N AN AN 2nd Harmonic Large amplitude of vibration A: Signal Generator B: Vibrator C; String D Pulley E: Weight to provide tension in string 3rd Harmonic 4th Harmonic D A C B E Table Vibrates with small amplitude S3P-1-21 C.M. Bali
Harmonics and Overtones • See Previous Slide 45 for experimental set up. • Look at the frequency on the signal generator as you set up stationary waves on the string. • The frequency is lowest when first harmonic is set up. This frequency is called the fundamental frequency. • As the number of harmonics increases, frequency increases. (note: the nth harmonic has n half waves.) • OVERTONES: When an instrument (e.g. a taut wire as in the experiment) is plucked, it produces a sound which is a combination of many harmonics. • Overtones can be displayed on the CRO and analyzed and shown to be composed of harmonics of that taut wire. • The first overtone is the first harmonic, the second overtone is the second harmonics, and so on. S3P-1-27 C.M. Bali
Quality or Timbre of Sound • When an instrument is played it does not produce a note of just one frequency. It consists of the fundamental frequency and higher harmonics with different amplitudes. The resultant wave is the superposed sum of various harmonics. Thus the resultant wave is different from that of the fundamental frequency. The ear responds to the fundamental frequency, but it also senses the presence of higher harmonics. This sensation due to the presence of many harmonics is called thequality of sound. Thus different instruments, and even the same instrument, generate sounds of different quality, even though they may be playing the same fundamental frequency. Play a tune from slide 4 http://www.dsokids.com/2001/instrumentchart.htm and observe the trace on the CRO C.M. Bali
Analysis of Quality or Timbre of SoundWith a graphing calculator Use TI83or the link below for a graphing calculator: • Without Fourier analyzing, we can see that a periodic non-sinusoidal function is the sum of many sinusoidal functions. Graphing Calculator:http://my.hrw.com/math06_07/nsmedia/tools/Graph_Calculator/graphCalc.html • Set window to : x min (-5), x max (5), y min (-2), y max (2); Xscl and Yscl =0.1 • Mode Radians. • Example: draw a graph of: Y = 1sin (x) + 0.75 sin (2x) + 0 sin (3x) +0.20 sin (4x) : You should see that Y is periodic but non-sinusoidal, the period being different from the periods of the component harmonics, (also draw individual graphs) • Thus quality is due the presence of many harmonics. C.M. Bali
Experiment The speed of a wave on a string • Set up the experiment as in slide 45. Record resonant frequency for the first, second and third harmonic. Enter the observations in the table below. Find average speed. Different students can try same material of different thicknesses and tensions. Precautions: Keep tension constant. Check L has not changed. C.M. Bali
An Experiment for IB or AP Students Problem: • The speed of a wave on a string is thought to depend on the tension in the string. Investigate the relationship between speed and tension. Idea: Let us suppose that the speed depends on the tension. We don’t know how it depends. [Theory must always precede experiment, even if we don’t realize it.] So assume – requires some thought! C.M. Bali