Download
1 / 30
300 likes | 400 Vues
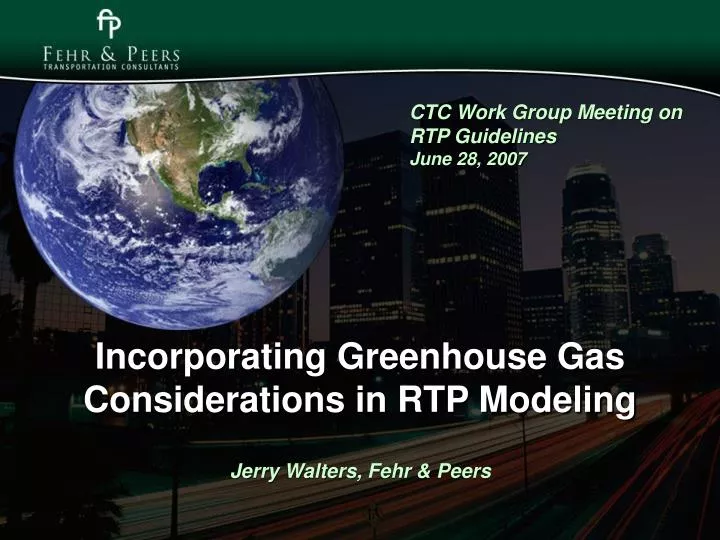
CTC Work Group Meeting on RTP Guidelines June 28, 2007. Incorporating Greenhouse Gas Considerations in RTP Modeling Jerry Walters, Fehr & Peers. Land Use Transportation Nets Built Environment TDM. Vehicle Miles Vehicle Trips Vehicle Speeds. CO 2 Emissions Other GHG. Global Warming.

E N D
CTC Work Group Meeting on RTP Guidelines June 28, 2007 • Incorporating Greenhouse Gas Considerations in RTP Modeling • Jerry Walters, Fehr & Peers
Land Use Transportation Nets Built Environment TDM Vehicle Miles Vehicle Trips Vehicle Speeds CO2 Emissions Other GHG Global Warming • Linkages between RTP and GHG Land Use and Transportation Policies
Built Environment Vehicle Miles Vehicle Trips CO2 Emissions • Linkage 1. 4D Relationships between Travel and Built Environment Land Use and Transportation Policies
Land Use Vehicle Miles Vehicle Trips CO2 Emissions • Linkage 2: • Induced Investment, Development, Travel Land Use and Transportation Policies
Transportation Nets TDM Vehicle Miles Vehicle Trips Vehicle Speeds CO2 Emissions • Linkage 3: Mobility Return on Investment Land Use and Transportation Policies
Linkage 1: 4D Relationships between Travel and Built Environment
Trip generation is directly related to D’s: • Densitydwellings, jobs per acre • Diversitymix of housing, jobs, retail • Designnetwork connectivity • Destinations regional accessibility • Distance to Transit rail proximity
Density (jobs and dwellings per acre) • Shortens trip lengths • More walking/biking • Supports quality transit
Diversity (mix of housing, jobs, retail) • Links trips, shortens distances • More walking/ biking • Allows shared parking
Destinations (accessibility to regional activities) Development at infill or close-in locations reduces vehicle trips and miles
Distance to Transit • Transit shares higher within ¼ mile and ½ mile of station
4D Elasticity Ranges Sources: National Syntheses, Twin Cities, Sacramento, Holtzclaw
Land Use Clustering, Mixing, Traditional Neighborhood Design – All Reduce Travel • Why it matters: 55% to 65% of trips are less than 3 miles. Up to 80% are less than 5 miles.
Shortcomings of Conventional Travel Models in Assessing Smart Growth • Primary use is to forecast long-distance auto travel on freeways and major roads • Secondary use is to forecast system-level transit use • Short-distance travel, local roads, non-motorized travel modes are not addressed in model validation
Typical Model “Blind Spots” • Abstract consideration of distances between land uses within a given TAZ or among neighboring TAZ’s • Limited or no consideration intra-zonal or neighbor-zone transit connections Network in Model Network in Field
Typical Model “Blind Spots” • Sidewalk completeness, route directness, block size generally not considered.
Typical Model “Blind Spots” • Little consideration is given to spatial relationship between land uses within a given TAZ (density) • Interactions between different non-residential land uses (e.g. offices and restaurants) not well represented
Potential Sources of Solutions • Assessment of Local Models and Tools for Analyzing Smart-Growth Strategies (Caltrans) • Urban Development, VMT and CO2 Emissions, (Smart Growth America) • Smart Growth INDEX(EPA) • Travel Characteristics of TOD in California(Caltrans/ Lund, Cervero, Willson)
Caltrans Study Conclusions • Assessment of Local Models and Tools for Analyzing Smart-Growth Strategies
Caltrans Study Recommendation • Assessment of Local Models and Tools for Analyzing Smart-Growth Strategies Use 4D’s to compensate for any lack of sensitivity in presiding model.
2 Induced Investment Development, Travel
Integrated Land Use/ Transportation Models • PECAS Users: Sacramento SACOG, Caltrans, SANDAG (considering), Ohio DOT, Baltimore MPO • URBANSIM Users: Salt Lake, Seattle, Houston, Honolulu, Detroit • UPLAN Users: Merced, Wilmington • What-If Users: Fresno
Cautionary Notes on PECAS, URBANSIM • Both are data intensive • Both require significant staff and/or consultant support to implement, use, maintain • Both require calibration and extensive model development • Validation experience very limited
3 Mobility ROI