Download
1 / 6
60 likes | 162 Vues
This study discusses challenges in estimating the burden of healthcare-associated infections in U.S. hospitals, using data sources like the NNIS System and AHA Survey in 2002. It reveals high infection rates and associated deaths, emphasizing the need for prioritizing public health interventions.

E N D
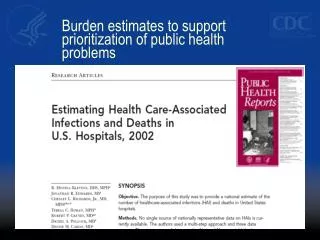
Burden estimates to support prioritization of public health problems
Challenges to National Estimates of Healthcare-Associated Infections in U.S. Hospitals • No single source of representative data available to estimate burden in the United States • In 2002, available data were • National Nosocomial Infections Surveillance System • American Hospital Association Survey • National Hospital Discharge Survey
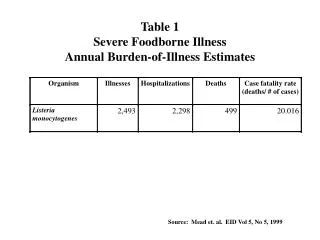
263,810 274,098 -967 -21 -28,725 244,385 TOTAL HRN WBN Non-newborn ICU = SSI 133,368 Other BSI 22% 11% SSI 20% UTI PNEU 36% 11% 424,060 129,519 Calculation of estimates of healthcare-associated infections in U.S. hospitals among adults and children outside of intensive care units, 2002 HRN = high risk newbornsWBN -= well-baby nurseriesICU = intensive care unitSSI = surgical site infectionsBSI – bloodstream infectionsUTI = urinary infectionsPNEU = pneumonia Klevens, et al. Pub Health Rep 2007;122:160-6
Rates of Healthcare-Associated Infections in Newborns, Adults, and Children by Site of Infection, National Nosocomial Infections Surveillance (NNIS) System Well-baby nurseryaHigh-risk nurserybIntensive care unitb(adults and children)Patient-daysc 7,436,520 4,835,702 30,236,811Major site of infection Rate of infection per 1,000 patient-daysUrinary tract 0.19 0.5 3.38Bloodstream 0.76 3.06 2.71Pneumonia 0.24 0.91 3.33Surgical site 0.003 0.2 0.95Other 1.37 2.21 2.67Total 2.56 6.88 13.04aFrom NNIS hospital-wide surveillance, 1990-1995bFrom NNIS surveillance 2002, high-risk nursery and ICU componentcFrom the National Hospital Discharge Survey (NHDS) for the U.S. population in non-federal hospitals
Estimated Number of Healthcare-Associated Infections in U.S. Hospitals by Subpopulation and Major Site of Infection, United States, 2002 Outside of Intensive care intensive careMajor site Well-baby High-risk unit (adults units (adults Unadjusted Adjustedof infection nursery nursery and children) and children)a total totalbPercentageUrinary tract 1,413 2,418 102,200 424,060 530,091 561,667 32Bloodstream 5,652 14,797 81,942 133,368 235,759 248,678 14Pneumonia 1,785 4,400 100,689 129,519 236,393 250,205 15Surgical site 21 967 28,725 244,385 274,098 290,485 22Other 10,188 10,687 80,732 263,810 365,417 386,090 17Total 19,059 33,269 394,288 1,195,142 1,641,758 1,737,125 100aSee proportions applied from description in Figure.bAdjusted for inclusion of federal hospitals by multiplying non-newborn values by 1.06 Klevens, et al. Pub Health Rep 2007;122:160-6
Burden of Healthcare-Associated Infections in the United States, 2002 • 1.7 million infections in hospitals • Most (1.3 million) were outside of ICUs • 9.3 infections per 1,000 patient-days • 4.5 per 100 admissions • 99,000 deaths associated with infections • 36,000 – pneumonia • 31,000 – bloodstream infections Klevens, et al. Pub Health Rep 2007;122:160-6