Understanding Descriptive Research: Central Tendency and Variability
This presentation, prepared by Nor Laili Fatmawati, Aminulloh Hendra, and Sudarso, explores descriptive research, focusing on its definition, purpose, and methodologies used to study current phenomena. Key themes include identifying problems, designing data collection instruments, and analyzing data. Various types of descriptive studies are reviewed, including surveys, case studies, and trend analyses. Additionally, the presentation highlights central tendency measures—mean, median, and mode—essential for summarizing data effectively. Learn how descriptive research provides valuable insights into the characteristics and behaviors within populations.
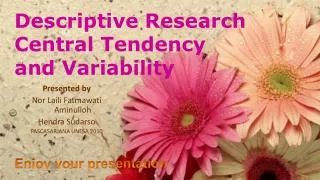

Understanding Descriptive Research: Central Tendency and Variability
E N D
Presentation Transcript
Descriptive Research Central Tendency and Variability Presented by Nor Laili Fatmawati Aminulloh Hendra Sudarso PASCASARJANA UNESA 2010 Enjoy your presentation
Descriptive Research Definition A research design used to obtain information concerning the current status or phenomena Purpose To describe the current state of affairs at the time of the study.
Descriptive Research • General steps in conducting descriptive studies • Stating the problem. • Identifying the information needed to solve the problem. • Selecting or developing the instrument for collecting data. • Identifying the target population and determination of any • necessary sampling procedure. • 5. Designing the procedure for data collection. • 6. Collecting the data. • 7. Analyzing the data. • 8. Preparing the report.
Descriptive Research • Some studies that can be classified as descriptive research • survey • case study • developmental studies • follow-up studies • documentary analysis • trend analysis • correlation studies.
Descriptive Research • Survey research • Survey research is used to study directly the characteristic of populations through the use of surveys. • Advantages • It allows the researcher to get a very broad picture of whatever is being studied • It is efficient in that the data collection part of the study is finished after one • contact is made with respondents and the information is collected • If it is done properly and with minimal sampling error, surveys can yield • remarkably accurate results. • Weaknesses • It can be the sources of bias, whether interviewer bias or interviewee bias • Sometimes people do not respond, as in the case of a mail survey.
Descriptive Research • Case study • Case study is a method used to study an individual or an institution in a unique setting or situation in as intense and as detailed a manner as possible. • Advantages • It allows for very close examination and scrutiny and the collection of • detailed data.It encourages the use of several different technique to get • the necessary information ranging from personal observations to • interviews of others who might know the focus of the case study. • No other way to get a richer account of what is occurring than through a • case study. • It suggests directions for further study.
Descriptive Research • Case study • Weaknesses • What the researchers see is not always what they get. • The notes the researchers record in their journal may accurately reflect reality or what they observe, but they may not. • What case studies provide in depth, they lose in breadth • We may not even think about trying to establish any cause-and-effect links between what we see and what we think might be responsible for the outcomes, • The generalizability of the findings is limited.
Descriptive Research • Developmental Research • Developmental research is a method to examine changes over time. • Two methods of Developmental research • Longitudinal method , • The same sample of subjects is studied over an extended period of time. • 2. Cross-sectional method. • To study subjects of various age levels at the same point in time.
Descriptive Research Follow-up Studies This is almost same with the longitudinal method. It is conducted to evaluate some programs that have been conducted. Documentary Analyses Documentary analyses are studying some documents for some purposes. It is not only content analyses but also can be sociological study and psychological variables and others.
Descriptive Research Trend Analyses Trend analyses are conducted to predict something that will happen in the future. The trend it self can be known from documentary analyses or surveys repeated at intervals which than possible the researchers to find the rate and direction of changes. Correlational studies These studies are focus on determining the extent of relationship existing between variables. They are conducted to measure the variation in a variable by associating it with the variation in the other variable. These studies are classified in the descriptive studies if the purpose is to describe relationship or to generate hypotheses and as ex post facto studies if hypothesis testing is the focus.
Measures of Central Tendency • Central tendency provides a single index to represent the average value of a whole set of measures. • Three kinds of central tendency • Mode • Median • Mean.
Measures of Central Tendency Mode Definition The most frequently value occurs. Example (for single data) 7 7 7 7 7 8 8 9 9 9 The mode is 7
Measures of Central Tendency Mode Example (for data in group)
Measures of Central Tendency • Median • Definition • The middle score in a distribution. • Example (for single data) • 7 9 7 8 6 7 9 5 • 6 7 7 7 8 8 9 9 • The median is 7 • 6 7 7 7 7 8 8 9 9 9 • The median is (7+8)/2 = 7,5
Measures of Central Tendency Median Example (for data in group)
Measures of Central Tendency Median
Measures of Central Tendency Mean Definition The sum of the whole scores divided by the number of the scores. Formula (for single data) = the mean ∑ = the sum of X = raw score N = the number of cases
Measures of Central Tendency • Mean • Example (for single data) • 7 9 7 8 6 7 9 5 Mean = 7,33
Measures of Central Tendency Mean Formula (for data in group) The age of students of Pascasarjana Unesa 2010 Mean = 33,4
Measures of Variability • Measure of variability tells us how spread out a group of scores are. • The functions of the measure of variability: • To know weather or not the mean is representative. For example: • The mean of teachers’ salary = Rp. 120.000,00 • Of course this mean is not representative because there are 4 teachers who have salary under the mean. It is because the data is very heterogeneous. • It helps the researcher in using statistic measurement in testing the hypothesis. Weather or not the sample comes fromk the same population.
Measures of Variability • Four kinds of Measure of variability • Range • Quartile deviation • Variance • Standard deviation.
Measures of Variability • Range • The range gives the distance between the highest and the lowest values in a distribution. • Formula • R = the range • = the highest value in a distribution • = the lowest value in distribution. • Example • 4 6 7 8 9 • So, R= 9 – 2 R= 7
Measures of Variability Quartile Deviation Quartile Deviation (QD) gives the half-distance between the upper (Q3) and lower quartiles (Q1). Formula Q3 = L + And for Q1, the formula is: Q1= L + i i After finding Q3 and Q1, we can find the QD by the following formula:QD= Q3 = the upper quartile Q1 = the lower quartile N = the number of case in the distribution
Measures of Variability Quartile Deviation After finding Q3 and Q1, we can find the QD by the following formula: QD= Q3 = the upper quartile Q1 = the lower quartile N = the number of case in the distribution i i L = the lower limit of the interval within whish the quartile lies cbl = the cumulative frequency below the interval containing the quartile fw = the frequency of cases within the interval containing the quartile i = the interval scale.
Measures of Variability Variance Variance is the mean of the squared deviation scores. Formula σ2= σ2 =the variance ∑ = the sum of r = the deviation of each score from the mean (X- )otherwise known as the deviation score. N = the number of case in the distribution.
Measures of Variability Standard Deviation Standard Deviation is the square root of the mean of the squared deviation of values from the mean. Formula σ = σ =the standard deviation ∑X2 = the sum of the squares of each score (that is, each score is first squared, then these squares are summed) (∑X2) = the sum of the scores squared (the scores are first summed, then this total is squared) N = the number of case in the distribution.
Year X X – (X – )2 1994 7,5 4,2 17,64 1995 8,2 4,9 24,01 1996 7,8 4,5 20,25 1997 4,9 1,6 2,56 1998 -13,7 -17,0 289,00 1999 4,8 1,5 2,25 2000 3,5 0,2 0,04 2001 3,2 26,4 3,32 -0,1 0,01 355,76 44,47 Total Mean VARIANS 2 = (X – )2/N