Download
1 / 36
360 likes | 511 Vues
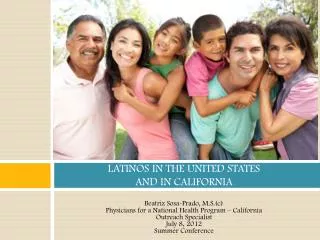
LATINOS IN THE UNITED STATES AND IN CALIFORNIA. Beatriz Sosa-Prado, M.S.(c) Physicians for a National Health Program – California Outreach Specialist July 8, 2012 Summer Conference. Latino Population in the U.S. 50.7 million Latinos 15.4% total U.S. population Not including undocumented

E N D
LATINOS IN THE UNITED STATES AND IN CALIFORNIA Beatriz Sosa-Prado, M.S.(c)Physicians for a National Health Program – CaliforniaOutreach SpecialistJuly 8, 2012Summer Conference
Latino Population in the U.S. • 50.7 million Latinos • 15.4% total U.S. population • Not including undocumented • By 2050, the Latino population is set to triple to 132.8 million¹
Latino Subpopulations in the U.S. • 2 largest Latino subpopulations: • Mexicans & Puerto Ricans • 65% Mexican • 9% Puerto Rican • Other Latino subpopulations • 3.5% Cuban • 8.5% Central American • 5.8% South American 2
Latino Population in California • 13.7 million Latinos • 37% of the total California population • Not including undocumented • Severe underreporting in census • The majority subpopulation in California is Mexican • 11.5 million; 31.2% 2
What does it mean to be a Latino in the U.S.? • The answer may be very different if you ask a black Dominican, a white Cuban, or a Panamanian, Colombian, Argentine, Honduran or Brazilian of any color (Andalo, 2004)
Characteristics Age Income Education Employment Characteristics of Latinos in the U.S. and in California
Age-specific Characteristics • Median age of Hispanics in U.S. is 27.3 y/o • 65.5 % is 18 y/o or older • Median age of U.S.’s total population = 36.8 • Median age of Hispanics in CA is 27 y/o • 65.4 % 18 y/o or older • Median age of CA’s total population = 34.9 2
Poverty Rates • Latinos in U.S.: 23.5% • American Indians & Alaskan Natives: 27.3% • Blacks: 25.8% • Native Hawaiians & Other Pacific Islanders: 15.1% • Whites: 11.7% • Asians: 11.4% • Latinos in CA : 20.6% • American Indians & Alaskan Natives: 22.9% • Blacks: 20.8% • Native Hawaiians & Other Pacific Islanders: 12.5% • Whites: 12.6% • Asians: 10.4% 3
Education-specific characteristics • U.S.: 60.9% of Latinos have attained a H.S. diploma or higher • 39.1% have less than a H.S. diploma, compared to 14.7% of the total U.S. population • CA: 56.7% have attained a H.S. diploma or higher • 43.3% have less than a H.S. diploma, compared to 19.4% of the total California population U.S. Census Bureau. (2009). 2009 American Community Survey 1-year estimates [Data file]. Retrieved December 20, 2010, from http://factfinder.census.gov/servlet/DatasetMainPageServlet?_program=ACS&_submenuId=&_lang=en&_ts
Employment-specific Characteristics • 69% of Latinos in the U.S. • 8.1% unemployed; 31.1% not in formal labor force • 68.5% of Latinos in CA • 8.8% unemployed; 31.5% not in formal labor force In the labor force… 2
Comparison Characteristics of Main Populations in California
Latino Cultural Values • Strong family ties • Familismo • Values • Respeto • Confianza • Religion • Espiritismo
Life Expectancy of Latinos For Latinos in the U.S., the life expectancy at birth is approximately 82 years. • Compared to: • 76 years in Mexico • 78 years in Puerto Rico • 77 years in Cuba • Average life expectancy for the general U.S. population as of 2007 is 77.9 yrs (U.S. Census Bureau, 2008)
Acculturation and Health Among Latinos • Acculturation: “the process by which an individual raised in one culture enters the social structure and institutions of another, and internalizes the prevailing attitudes and beliefs of the new culture”(Franzini et al., 2002)
Effects of Acculturation • Acculturation in the U.S. has affected the lifestyle of Latino subpopulations • Less fresh food • Less vegetables and fruits • Less exercise • The effects of acculturation on Latino health are complex and not well understood
Acculturation and Health Among Latinos • Acculturation is associated with… • negative health behaviors and outcomes: • Substance abuse • dietary practices • birth outcomes • positive health outcomes: • access to health care, • use of preventive services, • and self-perceptions of health
Acculturation and Health Among Latinos • More acculturated Latinos see themselves as healthier than less acculturated Latinos despite tendencies toward worse health outcomes (Lara et al., 2005), indicating cultural effects on wellness and perceptions of health
Leading Causes of Death among Latinos As of 2006, the top 5 leading causes of death among Latinos: • Heart disease • Cancer • Unintentional injuries • Stroke • Diabetes (National Center for Health Statistics, 2009)
Specific Health Issues among Latinos • Chronic Diseases • Infectious Diseases • Occupational Health Issues • Environmental Health Issues • Cultural, Linguistic and Literacy Level-Specific Barriers to Care
Occupational Health Issues Among Latinos • Jobs with high rates of unintentional injuries and exposure to health hazards • Among foreign-born Latinos, 59% higher work-related injury death rate than U.S.-born Latinos (CDC, 2008)
Migrant Health Issues • Occupational Health • Exposure to pesticides • Skin disorders • Infectious diseases • Lung problems • Hearing • Vision disorders • Strained muscles and bones • Unsanitary conditions and lack of potable water. • Migrant Lifestyle • Process of migration • Oral Health • Mental Health 3 NCFC. “Fact Sheet: Occupational Health and Safety.” http://www.ncfh.org/docs/fs-Occ%20Health.pdf
Environmental Health Issues • A large percentage of Latinos live and work in urban and agricultural areas exposed to dangerous hazards: • Air pollutants like ETS (environmental tobacco smoke), CO (vehicle exhaust), and natural gases • Pesticides • Unsafe drinking water • Lead and mercury contamination
Ways Ethnic/Racial Minorities are Disadvantaged in Health • General health status, characterized by higher rates of chronic/disabling illness • Lower likelihood of having health insurance • Linguistic barriers between the provider and patient • Racial attitudes and discrimination • Historical experiences, such as migration and segregation
Cultural, Linguistic and Literacy Level-Specific Barriers to Care • Limited English proficiency may negativelyaffect use of health care services • Spanish-only speaking Latino parents often rely on their English-speaking children to translate and mediate between them and their doctors • Health care quality is rated lower when the patient and provider speak different languages. 3
Cultural, Linguistic and Literacy Level-Specific Barriers to Care • Communicating directly with health professionals in a common language is associated with level of trust and confidence in medical settings. • When patients and providers speak the same language, foreign-born Latinos report that communication is improved and health care quality is perceived as better. 3
Health Care Gaps for Latinos • Lower likelihood of seeking or receiving health care services • Employers do not offer coverage • Thinking that one is healthy so we do not need it • Cultural lifestyle • Barriers to access health care contributes to lower health status and higher rates of morbidity and mortality
Latino Access to Health Care • 2 key components of health care access for Latinos: • Lack of medical insurance • Lack of regular health care provider
Latino Access to Health Care • Latinos have lowest rates of health insurance coverage in the U.S. and in CA • Latino subgroups with the lowest rates of health insurance coverage • Central Americans 39%; 42% • Mexicans 29%; 42% 3
Latino Access to Health Care • In a survey conducted by the Pew Hispanic Center (2007) with a nationally representative sample of 4,013 Latinos • 60% non-citizens not legal permanent residents lacked health insurance coverage • 28% of citizens or legal permanent residents lacked health insurance coverage Livingston, G. (2009, September 25). Hispanics, health insurance, and health care access. Retrieved from http://pewhispanic.org/files/reports/113.pdf
How do we improve access to care for Latinos? • Single payer (HR 676, SB 810) • Change in public perceptions and policies that facilitate access to health care among recent Latino immigrants • Health care for all • Improving cultural competency among health care Providers • Utilizing and engaging Community Health Workers (Promotore/as) • Reforms to improve the social and physical environments in which Latinos live • Perez-Escamilla, R. (2010). Health care access among Latinos: Implications for social and health care reforms. Journal of Hispanic Higher Education, 9(1), 43-60.
Why Minority Health is Important? • Explosion in Latino and Asian populations • Increased immigration and increased fertility • By 2050, racial/ethnic “minorities” will be the majority (LaVeist, 2002) • The health of U.S. racial/ethnic groups will inevitably reflect the health of the nation as a whole--“Their” health will be “our” health.
References 1. U.S. Census Bureau. (2009). Facts for features: Hispanic heritage month 2009: Sept. 15 – Oct. 15 [Fact sheet]. Retrieved March 17, 2010, from http://www.census.gov/Press-Release/www/releases/pdf/cb09ff-17_hispmonth09eng.pdf 2 U.S. Census Bureau. (2009). 2009 American Community Survey 1-year estimates [Data file]. Retrieved December 20, 2010, from http://factfinder.census.gov/servlet/DatasetMainPageServlet?_program=ACS&_submenuId=&_lang=en&_ts Andalo, P. (2004). Health for one and all: Latinos in the USA. Perspectives In Health, 9(1), 2004 4. http://www.pewhispanic.org/2012/06/27/country-of-origin-profiles/