Liquids
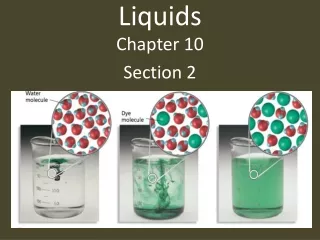
Liquids. Properties of Liquids. You already know some of the properties of liquids: fixed volume, but no fixed shape. But there are several important properties of liquids which you need to know (and probably have already heard of). Liquids.

Liquids
E N D
Presentation Transcript
Properties of Liquids • You already know some of the properties of liquids: fixed volume, but no fixed shape. • But there are several important properties of liquids which you need to know (and probably have already heard of).
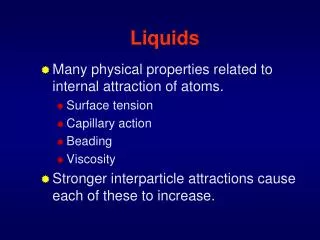
Liquids • Viscosity: this is the resistance to flow which a liquid has. The higher the viscosity, or the more viscous a liquid is, the slower and more sluggishly it flows. (think of your ketchup or honey or molasses) • Why are some liquids more viscous than others? Intermolecular forces! • The stronger the intermolecular forces, the more the molecules are “glued” together, so they resist flowing more. • After all, to flow freely implies that the molecules “slide” past each other. • They can’t “slide” if they are “glued” together.
Liquids • Surface Tension: this is a liquid’s resistance to increasing its surface area. • We can think of it as the tendency of a liquid to “bead” up or not spread. • Mercury and water are 2 liquids which bead up or have a high surface tension. • Again, high intermolecular forces “glue” molecules (or atoms) together, so they resist spreading. • The atoms or molecules on the surface of the liquid are strongly attracted to the inner portion of the liquid, which helps “hold” a bead together, or keep the liquid from spreading.
Liquids • Capillary Action: Now we have 2 forces: the atoms or molecules of a liquid are holding them together, but the atoms or molecules are also attracted to the surface of the container. So the molecules of a liquid tend to “creep” up the sides of the container. • This is what causes the meniscus that you know and love when you pour water into a glass container. • In glass containers, water molecules are strongly attracted to the glass sides and so “creep” up the sides. But water molecules not along the container walls don’t feel this attraction, and so undergo the normal surface tension force. • So we see a curved meniscus, where capillary action is stronger than the surface tension.
Phase Changes • We’ve already talked about the 6 phase changes and their signs for DH.
Phase Changes • Because of the very high energy of the gas phase, the enthalpy changes are very large for any transition which involves the gas phase. • For example, the ΔH°vap for water is 40.67 kJ/mol. In contrast, the ΔH°fus for water is 6.01 kJ/mol. • What’s ΔH°sub?
Phase Changes • Heating and cooling curves are often used when we heat up a substance from 1 temperature to another. • We can also calculate the ΔH for the overall process. • For example, what happens to water when we heat it from -50.0°C to 120.0°C? • There are several regions on this heating curve:
Phase Changes • -50.0°C to 0°C: the solid water is warming up. ΔH = mcpΔT; wherecp is for ice. • at 0°C: the solid water changes to liquid water. ΔHfus = (n)(6.01 kJ/mol) • 0°C to 100°C: liquid water warms up. ΔH = mcpΔT • 100°C : liquid water changes to steam ΔHvap = (n)(40.67 kJ/mol) • 100°C to 120.0°C: steam heats up to become superheated steam (it’s verydangerous). ΔH = mcpΔT; wherecp is for steam
Phase Changes • Problem: How much heat energy is required to convert 67.9g of ice at -25°C to superheated steam at 123°C?
Vapor Pressure • The vapor pressure of a liquid is a reflection of how easily the liquid escapes into the vapor phase at a given temperature. • Liquids with high vapor pressures are volatile liquids, with low boiling points • Liquids with low intermolecular forces tend to be volatile, so they become gases easily.
Vapor Pressure • But even water has a measurable vapor pressure! • What happens if you leave a glass of water out for a month or two? • It evaporates (slowly, but it does). • So even though it is not at its boiling temperature, a liquid may evaporate into the gas phase.
This is because some of the molecules have enough KE to escape.
Vapor Pressure • If you half-fill a jar with water and then cap it, you will initially have no water molecules in the vapor phase. • But some will escape into the gas phase as they have enough KE. • But once you have water vapor, they may recondense into the liquid phase if they hit the surface of the walls and liquid.
Vapor Pressure • So we have both processes, evaporation and condensation, occurring simultaneously. • After some time has passed, water molecules are vaporizing and condensing at equal rates. This is called a dynamic equilibrium, where the forward and reverse rates are equal. • Dynamic equilibria systems are common and important.
Clausius-Clapeyron Equation • OK, so liquids can evaporate below their boiling point. • But what happens as we increase the temperature? • How does the vapor pressure change?
Clausius-Clapeyron Equation • As the temperature increases, the vapor pressure increases as well. • But… • When we graph the vapor pressure of a liquid vs. temperature, the graph is not linear.
Clausius-Clapeyron Equation • However, if we graph the natural log of the vapor pressure vs. 1/T, we get a straight line. • This relationship between vapor pressure and temperature is called the Clausius-Clapeyron equation:
Clausius-Clapeyron Equation • In this equation, the slope of the line is –ΔHvap/R while the y-intercept is C. As ΔHvapis given in kJ/mol, the R used is 8.314 J/molK (really 8.314x10⁻³ kJ/molK).
Clausius-Clapeyron Equation • This equation is usually used to find ΔHvapfor a liquid by graphing the vapor pressure and temperature data for a liquid (or with math). • The equation may also be used to find the vapor pressure of a liquid at any temperature, so long as you know the ΔHvapand the vapor pressure for another temperature. • The above is possible as C is constant no matter what the temperature or pressure is.
Boiling Point • The boiling point of a liquid has a very precise definition. • The boiling point is the temperature at which the vapor pressure of the liquid equals the external pressure. • This means that the boiling point for a liquid varies with external pressure. • At normal sea-level atmospheric pressure, 1 atm, the boiling point is called the normal boiling point. • You actually can read the boiling point on a vapor pressure-temperature curve like the above.
Phase Diagrams • You’ve seen a vapor pressure curve and a boiling point curve. • But we also want to see the other phase changes on a pressure-temperature graph as well. • A graph which shows all 3 states of matter and the phase change curves is called a phase diagram.
Phase Diagrams • The above phase diagram is for a typical compound. • Note that the far left and top is the solid phase, the middle is the liquid phase and the far right and bottom is the gas phase. • The curves are the phase boundaries, showing the pressure and temperature at which a certain phase change occurs.
Phase Diagrams • These curves are the vapor pressure curve, the sublimation curve, and the melting curve (of fusion curve). • Notice how steep the melting point curve is, it is almost vertical. So melting points are almost independent of pressure. This is because, as you would expect, solids and liquids are not very compressible.
Phase Diagrams • If you know the temperature and pressure, you know where you are on the diagram, and what state the compound is in. • If the compound is on the curve, then it is in equilibrium between phases.
Phase Diagrams • Note that there is a point where the 3 phases meet (some compounds don’t have this point, others have more than 1). • This point where the 3 phases meet is called the triple point, for the 3 phases. • At the triple point, all 3 phases are at equilibrium at that temperature and pressure.
Phase Diagrams • Also note that above a certain temperature and pressure, the curves stop. • This is because at this temperature and pressure, it is no longer possible to have a normal gas or liquid phase. • Instead the substance exists as a supercritical fluid, with densities and viscosities similar to liquids, but as compressible or expandable as gases.
Phase Diagrams • The critical temperature is defined as the temperature at which it is no longer possible to condense a gas into a liquid, no matter what the pressure. • The critical pressure is defined as the pressure at which it is no longer possible to vaporize a liquid, no matter what the temperature. (It is the pressure at the critical temperature.)
Phase Diagrams • Let’s take a look at the phase diagrams for carbon dioxide and water:
Phase Diagrams • How are they different? • Do you notice the different slope to the melting point curve? • For CO2, this slope is positive, while it is negative for water. • Most substances are like CO2 with this positive melting point curve slope. • What does this mean?
Phase Diagrams • For water, it means that if you are on the melting point curve and the pressure is increased, then the solid melts to become a liquid. • But increasing the pressure means that the particles are closer together, so liquid water is more dense than ice.
Phase Diagrams • For CO2 and most other substances, the positive slope means that as the pressure increases, the liquid becomes a solid, so the solid is denser than the liquid. • What else does this mean?
Phase Diagrams • For water, it also means that the melting point decreases with increasing pressure. Thus, with increasing pressure, the particles get closer, the H-bonds in the ice crystal break. So the melting point decreases.