Download
1 / 54
570 likes | 902 Vues
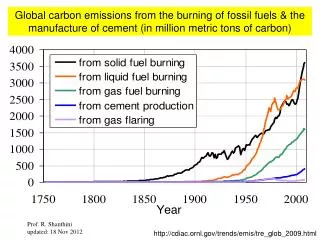
Global carbon emissions from the burning of fossil fuels & the manufacture of cement (in million metric tons of carbon). http://cdiac.ornl.gov/trends/emis/tre_glob_2009.html. Global carbon emissions from the burning of fossil fuels & the manufacture of cement (in million metric tons of carbon).

E N D
Global carbon emissions from the burning of fossil fuels & the manufacture of cement (in million metric tons of carbon) http://cdiac.ornl.gov/trends/emis/tre_glob_2009.html
Global carbon emissions from the burning of fossil fuels & the manufacture of cement (in million metric tons of carbon) http://cdiac.ornl.gov/trends/emis/tre_glob_2009.html
Global Carbon Cycle (in billions metric tons carbon) http://www.eia.gov/oiaf/1605/ggccebro/chapter1.html
Atmospheric Carbon Dioxide Concentrations 391.5 ppmv in 2011 (in ppmv) 275 ppmv in pre-industrial time ftp://ftp.cmdl.noaa.gov/ccg/co2/trends/
Global Carbon Emissions: present & future (in millions metric tons of carbon equivalent) http://www.eia.gov/oiaf/1605/ggccebro/chapter1.html
Greenhouse Gases (GHGs) including Carbon dioxide GHGs are gases in an atmosphere that absorb and emit radiation within the thermal infrared range. This process is the fundamental cause of the greenhouse effect.
The Greenhouse effect A T M O S P H E R E S U N G R E E N H O U S E G A S E S
The main GHGs in the Earth's atmosphere are water vapor, carbon dioxide, methane, nitrous oxide, and ozone. Without GHGs, Earth's surface would be on average about 33°C colder than at present.
Global Warming The burning of fossil fuels, land use change and other industrial activities since the industrial revolution have increased the GHGs in the atmosphere to such a level that the earth’s surface is heating up to temperatures that are very destructive to life on earth.
The global temperature has risen by 0.74 ± 0.18°C over the last century (from 1906 to 2005). Source: Fourth Assessment Report (AR4) of Intergovernmental Panel on Climate Change (IPCC) Compare the above with the fact that the global temperature has not varied by more than 1 or 2oC during the past 100 centuries. Global warming has begun, and so has the Climate Change.
Consequences………… World’s first environmental refugees from Carteret Islands, Papua New Guinea. • Persistent flooding is causing the submergence of the Carteret Islands. • Saltwater intrusion is contaminating the islands freshwater supply and preventing the growth of crops. • The islands were declared uninhabitable by the government in 2005 and expected to be completely submerged by 2015. Source: http://earthtrends.wri.org/
Consequences………… • death of coral reefs • fewer cubs for polar bears • spread of dengue and other diseases • heavy rains & severe draughts • fires, floods, storms, & hurricanes • changed rainfall patterns • warming and aridity • loss of biodiversity
Rate of increase of CO2 concentration (in ppmv/year) 1.8 ppmv/year in 2011 ftp://ftp.cmdl.noaa.gov/ccg/co2/trends/
CO2 concentration in the future (ppmv) global temperature may be up by 2oC
At the rate of 1.5 ppmv of CO2 increase per year, 400 ppmv CO2 will be reached in 2017, and it is probable that the global temperature would go up by 2oC (compare it with the 0.01oC per decade estimate by WWF). -Accelerated Climate Change -Mass extinctions -Ecosystems breakdowns -Large scale discontinuities
Some say, forget about the 2oC. The limit is not 400 ppmv CO2. It is550 ppmv CO2(which is nearly twice the pre-industrial value), which we may reach not.
CO2 concentration in the future (ppmv) We are lucky. Are we?
U.S. Climate Change Science Program (CCSP): Computer models of future CO2 emissions and controls on atmospheric CO2 have been developed by CCSP. These models indicate that projected annual global emissions during the next century would need to be reduced by more than 75% in order to stabilize atmospheric CO2 at about 550 ppm. According to the CCSP, stabilizing atmospheric CO2 would "require a transformation of the global energy system, including reductions in the demand for energy, and changes in the mix of energy technology and fuels." http://geology.com/usgs/sequestration/
Discussion Point 5: Should we place a upper sealing limit on the global CO2 emissions to ensure sustainable development?
Calculation of Global Sustainable Limiting Rate of Carbon Dioxide Production: 1. Virgin material supply limit: To stabilize the atmospheric CO2 concentration below approximately 550 ppmv by the year 2100, global anthropogenic emissions must be limited to about 7 to 8 x 10¹² kg (= 7 to 8 giga tonnes) of C per year (IPCC, 1996). Source: Graedel, T.E. and Klee, R.J., 2002. Getting serious about sustainability, Env. Sci. & Tech. 36(4): 523-9
Calculation of Global Sustainable Limiting Rate of Carbon Dioxide Production: • 2. Allocation of virgin material: • Each of the average 7.5 billion people on the planet over the next 50 years is allocated an equal share of carbon emissions. • That is roughly 1 tonne (1000 kg) of C equivalents per person per year, • which is roughly 3.8 tonne of CO2 equivalents per person per year. Source: Graedel, T.E. and Klee, R.J., 2002. Getting serious about sustainability, Env. Sci. & Tech. 36(4): 523-9
USA Sustainable limit Sri Lanka Sources: http://hdrstats.undp.org/buildtables/rc_report.cfm
USA Norway Singapore Sustainable limit Sri Lanka Iceland Japan Sources: http://hdrstats.undp.org/buildtables/rc_report.cfm
LI EI GDPI + + HDI = 3 3 3 Life Expectancy - 25 LI (Life Index) = 85 - 25 2 Adult Literacy 1 School Enrollment EI (Education Index) = + 3 100 3 100 ln(GDP per capita) - ln(100) GDPI (GDP Index) = ln(40000) - ln(100) UNDP defined Human Development Index (HDI)
HDI > 0.8 Unsustainable amount of per capita CO2 emissions are required to reach super high HDI (> 0.9) USA Sustainable limit Sri Lanka Sources: http://hdrstats.undp.org/buildtables/rc_report.cfm
Discussion Point 6: How to limit the CO2 emissions below the sustainable limit? Take 10 mins.
Emissions Reduction Option 1: Increase the use of carbon sinks (such as forests where 70% of all photosynthesis occurs). But, we replace our forests with cities, highways & golf courses. Stop destroying forests, and grow more trees.
The forest cover is already too small to help reducing global warming. How long does it take to grow a tree like this?
Emissions ReductionOption 2: Change to non-CO2 emitting energy sources What are they? Nuclear Hydro Renewables (Geothermal, Solar, Wave, Tidal, Wind, Biomass and Biogas) Muscle Power
World Energy Consumption by Fuel (in 1015 BTU) http://www.eia.doe.gov/pub/international/iealf/table18.xls
World Energy Consumption by Fuel (in %) http://www.eia.doe.gov/pub/international/iealf/table18.xls
World Energy Consumption by Fuel (in %) http://www.eia.doe.gov/pub/international/iealf/table18.xls
World Energy Consumption by Fuel (in %) http://www.eia.doe.gov/pub/international/iealf/table18.xls
There is no immediate financial benefits for a switch to renewable energy in the profit-oriented energy markets.
Projection of World Energy Consumption by Fuel (in %) United States Energy Information Administration, 2011
Emissions Reduction Option 3: Reduce Population More people More pollution
Electricity use in 2006 If you are in USA, you will be lighting 18.5 bulbs, each with 200 W power If you are in China, you will be lighting 3 bulbs, each with 200 W power
CO2 emissions per capita has stronger links with GDP per capita than with population.
Emissions Reduction Option 4: Carbon Capture & Storage (CCS) Controversial since permanent storage of CO2 underground is not guaranteed
Controversial since the impacts on marine ecosystem (very fragile) are not known
Environmental issues: Potential for mobilization of ground-water contaminants; leakage of CO2 and CO2-saturated saline water; induced seismicityRegulatory issues: Determination of rules affecting injection wells; multiple regulatory jurisdictions (State, Federal, local); post-injection ownership and liability http://geology.com/usgs/sequestration/
U.S. Climate Change Science Program (CCSP): The CCSP models illustrate the widely held view that sequestration is necessary but insufficient to control atmospheric CO2. Stabilizing atmospheric CO2 is likely to require substantial changes in energy sources and use as well as carbon management. http://geology.com/usgs/sequestration/
Discussion Point 7: What could you do to limit the CO2 emissions below the sustainable limit as an engineer? Take 10 mins.