
ABSTRACT
Effects of Prescribed Fire and Fire Surrogates on Insect Pollinators of North Carolina. ABSTRACT

ABSTRACT
E N D
Presentation Transcript
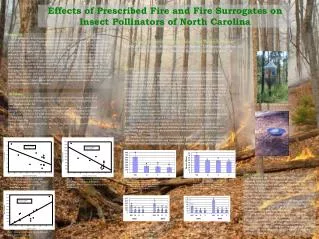
Effects of Prescribed Fire and Fire Surrogates on Insect Pollinators of North Carolina ABSTRACT Pollination by insects in forests is an extremely important process that should be conserved. Not only do pollinating insects maintain a diversity of plants within forests, but also aid in pollinating crops that are found near forested land. Unfortunately, pollinating insect populations have shown declines in recent decades throughout the world. Currently, the effects of various forest management practices on floral visiting insect abundance or diversity is unknown. In 2003 and 2004, floral visiting insects were captured with malaise and colored pan traps from burn, mechanical, mechanical plus burn, and untreated plots of forest land in North Carolina. We caught 7921 floral visitors from four orders and 21 families. Hymenoptera was the most abundant and diverse order, with Halictidae being the most abundant family. Six families and 45 species of Hymenoptera were caught. We caught seven families and 35 species of Lepidoptera, six families and 33 species of Coleoptera, and two families and 13 species of Diptera. The majority of floral visitors were captured in the mechanical plus burn treatments, while similar numbers were caught on the mechanical only treatments, burn only treatments and control treatments. Overall species richness was also higher on mechanical plus burntreatmentscompared to other treatments. Joshua W. Campbell1, James L. Hanula1, and Thomas A. Waldrop21USDA Forest Service, Southern Research Station, 320 Green St., Athens, GA 2USDA Forest Service, Southern Research Station, Clemson, SC RESULTS The majority of floral visitors were captured in the mechanical plus burn treatments, while similar numbers were caught on the mechanical only treatments, burn only treatments and control treatments (Fig 3). Overall species richness was also higher on mechanical plus burntreatmentscompared to other treatments (Fig 4). Hymenoptera were significantly higher in abundance on mechanical plus burn treated plots in 2003 and 2004 (Fig. 5). In 2003, Halictidae, was the most commonly captured family of Hymenoptera and both Halictidae (p<0.05) and Anthophoridae (p≤ 0.085) were captured in significantly higher numbers on mechanical plus burn treatments in 2003. In 2004, Halictidae, Apidae, and Sphecidae were significantly higher in abundance on mechanical plus burn treatments. Species richness of Hymenoptera was also higher on mechanical plus burn. The mechanical plus burn treated plots had significantly higher numbers of Diptera in 2003 and 2004 compared to the other treatments. Syrphidae was the most common family of floral visiting Diptera comprising 99% of the total caught. Coleoptera were significantly higher (p<0.05) in abundance on the mechanical plus burn treated plots in 2004 and 2003 (p≤0.079) (Fig. 6) Species richness was also significantly higher on mechanical plus burn treated plots. Lepidoptera were slightly higher in abundance on mechanical plus burn treated plots in both years but there were no significant differences among treatments. Species richness was significantly higher (p≤0.07) on the mechanical plus burn treatment plots than on the mechanical only or control plots. Regression analyses of change in basal area and percent plant cover found a relationship of increased plant cover with decreasing basal area (Fig. 7). Total pollinator abundance also increased as basal area decreased (Fig. 8) or as percent plant cover increased (Fig. 9). METHODS *10 ha plots of mechanical plus prescribed burn, prescribed burn only, mechanical only, and control plots were designed in the Green River Game Management Area near Hendersonville, NC. *malaise traps with blue, white, yellow and red colored panels (Fig 1) and colored pan traps (blue, white, yellow) (Fig 2) were used to collect pollinating insects *traps were operated at 4-6 week intervals from April-October of 2003 and 2004. *we trapped five times in 2003 and six times in 2004, with each trapping period lasting seven days. *basal area and % herbaceous plant cover was measured and compared with the pollinating insect data. Fig 1. Malaise trap with colored panels r2=0.39, p=0.029 y=19-1.4x r2=0.71, p=0.0006 y=573.9+110x Fig 2. Blue Pan Trap DISCUSSION Mechanical plus burn treatments caused the greatest changes in basal area of trees because increased fuel loads on the plots resulted in hotter fires and more tree mortality. The combination of removing the dense understory of mountain laurel and rhododendron combined with some overstory tree mortality allowed more sunlight to reach the forest floor resulting in greater herbaceous plant cover. Although, it is unclear what caused the increased numbers of pollinators, a combination of factors (nectar/pollen resources, suitable nesting structure, etc.) is likely to be important in sustaining pollinator populations in forests. Clearly forest management practices can be used to influence pollinating insect abundance and diversity. In this study, the mechanical plus burn treatments proved to be the best for increasing pollinator abundance. However, continued burning, periodic thinning or both over time might be as effective as the mechanical plus burn treatments in providing conditions that favor pollinators. Fig 7. Linear regression of % plant cover and change in basal area. Negative numbers indicate a post-treatment decrease in basal area. Fig 8. Linear regression of total pollinators and change in basal area. Negative numbers indicate a post treatment decrease in basal area. Fig 3. Total mean pollinators captured during 2003 and 2004. Columns with the same letter are not significantly different at p0.05 (REGWQ, SAS 1985). Treatments were: MB=mechanical plus burn, M=mechanical, B=burn, C=control. Fig 4. Species richness of floral visiting insects captured in 2003 and 2004. Columns with the same letter are not significantly different at p=0.05, REGWQ, SAS 1985; MB=mechanical plus burn, M=mechanical, B=burn, C=control r2=0.58, p=0.0042 y=-239.6+44.8x Fig 5. Mean abundance of Hymenoptera for the two collecting years Columns with the same letter are not significantly different at p0.05 (REGWQ, SAS 1985). Treatments were: MB=mechanical plus burn, M=mechanical, B=burn, C=control. . Fig 6. Mean abundance of Coleoptera for the two collecting years Columns with the same letter are not significantly different at p0.05 (REGWQ, SAS 1985). Treatments were: MB=mechanical plus burn, M=mechanical, B=burn, C=control. Fig 9. Linear regression of total pollinators and % herbaceous plant.


