Download

1 / 30
320 likes | 674 Vues
Inflation and Unemployment. The Phillips Curve. Inflation and Unemployment. The last few weeks we’ve been looking at the AD-AS model Within that model we first added fiscal policy Then we added money and monetary policy The goal of policy is to affect real GDP, unemployment and inflation.

E N D
Inflation and Unemployment The Phillips Curve
Inflation and Unemployment • The last few weeks we’ve been looking at the AD-AS model • Within that model we first added fiscal policy • Then we added money and monetary policy • The goal of policy is to affect real GDP, unemployment and inflation. • Both fiscal and monetary policy affect both prices and real GDP. • However, in practice • Fiscal policy tends to focus on unemployment • Monetary policy tends to focus on inflation
Policy, Inflation and Unemployment • Economic policy as we’ve looked at it work primarily on the AD curve. • Contractionary policy shifts the AD to the left. • Expansionary policy shifts the AD to the right. • In both cases, inflation and unemployment move opposite one another.
Expansionary Monetary Policy Shift out of AD Prices up, unemployment down (real GDP up) Price level SAS P2 P1 AD2 AD1 Y1 Y2 Real GDP
Contractionary Monetary Policy Shift in the AD Prices down, unemployment up (real GDP down) Price level SAS P1 P2 AD1 AD2 Y2 Y1 Real GDP
Inflation and Unemployment • From 1950 through the early 1960s inflation hovered around 3 percent per year. • Then the shift in AD that accompanied the Vietnam War and the Great Society programs that Johnson pushed through Congress pushed inflation up to a little above 4 percent – and unemployment fell. • In 1971 Nixon imposed wage and price controls • They had little effect – inflation and unemployment both increased.
Inflation and Unemployment (cont.) • The first OPEC embargo cut oil supplies in 1972, and the Iranian revolution further cut oil supplies in 1979; inflation took off • Unemployment rose as well. • After Reagan took office, the international petroleum market stabilized, and the Fed practiced a tight money policy. • Inflation fell back to around the 4 percent per year.
United States Inflation and Unemployment, 1960-1999 I II III IV Period I – moving opposite Period II – unstable, moving together Period III – unstable, both falling Period IV – stable, moving together
Inflation and Unemployment • Notice the differences. • Sometimes inflation and unemployment move opposite – like period I • Sometimes they move together – like period II • The problem now is to explain why we see the two different patterns.
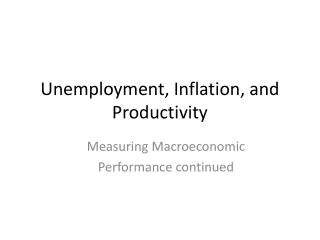
Types of Inflation • Demand-Pull inflation comes when unemployment is lowered by shifting the AD curve. • Cost-Push inflation comes when unemployment increases by shifts in the SAS curve.
Demand-Pull Inflation Shift out of AD Prices up, unemployment down (real GDP up) So demand – pull inflation comes from shifts out in the AD curve. We can tell it is demand – pull because real GDP goes up, meaning unemployment goes down. Price level SAS P2 P1 AD2 AD1 Y1 Y2 Real GDP
Demand-Pull Inflation But suppose Y1 was potential GDP (LAS) The AD shift to AD2 creates an inflationary gap. LAS Price level Which closes by the SAS shifting to the left (to SAS2). SAS2 P4 SAS1 P3 Causing the price level to go up to P3, and real GDP to return to Y1 P2 To keep unemployment lower than the normal rate associated with potential GDP requires ever shifting AD (for example, to AD3) P1 AD3 AD2 AD1 Meaning ever increasing prices (to P4) Y1 Y2 Real GDP
Cost-Push Inflation Shift in the SAS Prices up, unemployment up (real GDP down) Price level SAS2 So cost –push inflation comes from shifts to the left of the SAS curve. We can tell it is cost – push because real GDP falls, meaning unemployment goes up. SAS1 P2 P1 AD1 Y2 Y1 Real GDP
Cost-Push Inflation But suppose Y1 was the LAS LAS Then the economy adjusts by the SAS shifting back to SAS1 Price level SAS2 SAS1 Prices fall and real GDP goes up – so unemployment falls P2 P1 Cost-push inflation rights itself over time AD1 Y2 Y1 Real GDP
National Income, unemployment and potential GDP • A key factor is the relationship between unemployment and the LAS • The level of unemployment at the LAS is called the NAIRU – it is the “natural” rate of unemployment • If NI > potential NI then unemployment < NAIRU. • If NI = potential NI then unemployment = NAIRU. • If NI < potential NI then unemployment > NAIRU.
Inflation and Unemployment • So we might expect two patterns • Decreasing unemployment and increasing prices (inflation) from demand-pull inflation • Increasing unemployment and increasing prices (inflation) from cost-push inflation (we termed this stagflation earlier).
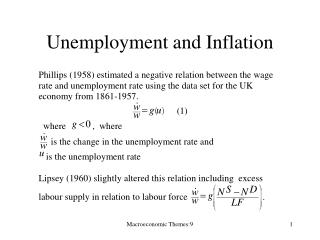
Birth of the Phillips Curve • Economists (especially PCB Phillips) in 1950s and 1960s noticed the pattern of unemployment and inflation that comes from Demand-Pull inflation • From WWII to about 1960, most periods of high unemployment were accompanied by low inflation, and low unemployment was accompanied by high inflation • Developed the Phillips curve, showing a negative relationship between unemployment and inflation.
The Phillips Curve Inflation The Phillips curve showed a negative relationship between inflation and unemployment. I2 Economists thought there was a policy menu Choose high unemployment and low inflation Or low unemployment and high inflation I1 U2 U1 unemployment
But then the pattern fell apartin the late 1960s to late 1980s
The Phillips Curves! Three periods of different tradeoff-off levels of demand-pull inflation: 1970-1973 1974-1979 1980-1983 Then a shift back down in 1984-1991 (back to the yellow curve)
The Long Run Phillips Curve • So how do we move between the short run Phillips curves? • The answer starts with the adjustment to equilibrium • Recall, normal adjustment is by the SAS • It shifts left or right, depending on if we are in an inflationary gap (shifting left) or a recessionary gap (shifting right)
Expectations and Adjustment To lower unemployment, policy makers shift the AD to AD2 creating an inflationary gap. Which closes by the SAS shifting to the left (to SAS2). People come to expect higher inflation (higher prices). LAS Price level SAS2 Which means at the higher price level (greater inflation) unemployment returns to its normal level. SAS1 P3 P2 P1 AD2 AD1 Y1 Y2 Real GDP
The Long Run Phillips Curve inflation LR Phillips Curve In the long run there is no tradeoff between inflation and unemployment. Unemployment returns to its “normal” rate (the NAIRU – noted at U* in the graph) whatever the rate of inflation might be. U* unemployment
The Long Run and Short Run Phillips Curves inflation At any point on the LR Phillips curve there is a short run Phillips curve that allows the tradeoff between inflation and unemployment. LR Phillips Curve Policy makers might choose point 1, with low unemployment (U1) but higher inflation (F1). 1 F1 As people come to expect inflation of F1, the short run Phillips curve shifts to the right and unemployment returns to U* while inflation stays at F1. The short run Phillips curve shifts to SPC2. SPC2 SPC1 U1 U* unemployment
The Long Run and Short Run Phillips Curves inflation LR Phillips Curve So if people expect low inflation, the short run Phillips curve is low on the long run Phillips curve, like SPC1. SPC2 But if people expect high inflation, the short run Phillips curve is high on the long run Phillips curve, like SPC2. SPC1 U* unemployment
Expectations are Important! • Policy makers, especially the FED, work to keep expected inflation low. • The FOMC was committed in the 1990s, especially the later part of the 1990s, to fight inflation, even if unemployment was high. • The goal was to keep on a lower Phillips curve.
Successful FED Policy • In mid-1990s, people had come to expect an inflation rate at 3% or more. • Short run Phillips curve was high. • By being diligent, the FED lowered general expectations about inflation. • The short run Phillips curve shifted down, and unemployment returned to its normal level – near the long run normal level of 4-5%. • Terrorism and now oil price shocks have pushed inflation expectations back up. • The short run Phillips curve shifted up now.
LRPC mid 1990s most recent Late 1990s