Download

1 / 16
180 likes | 497 Vues
Lecture 16: Bohr Model of the Atom. Reading: Zumdahl 12.3, 12.4 Outline Emission spectrum of atomic hydrogen. The Bohr model. Extension to higher atomic number. Photon Emission. System drops from a higher energy level to a lower one by spontaneously emitting a photon.

E N D
Lecture 16: Bohr Model of the Atom • Reading: Zumdahl 12.3, 12.4 • Outline • Emission spectrum of atomic hydrogen. • The Bohr model. • Extension to higher atomic number.
Photon Emission System drops from a higher energy level to a lower one by spontaneously emitting a photon. DE = hc/l • If l = 440 nm, DE = 4.5 x 10⁻¹⁹ J Emission
“Continuous” spectrum “Quantized” spectrum DE DE Any DE is possible Only certain DE are ‘allowed’ transitions
Emission spectrum of atomic H Light Bulb: Continuous spectrum Hydrogen Lamp: Discrete lines only Quantized, not continuous
We can use the emission spectrum to determine the energy levels for the hydrogen atom.
Balmer Model • Joseph Balmer (1885) first noticed that the frequency of visible lines (transitions) in the H atom spectrum could be reproduced by a formula where frequency (v) varies according to: n = 3, 4, 5, ….. • The above equation predicts that as n increases, the frequencies become more closely spaced.
Rydberg Model • Johann Rydberg extends the Balmer model by finding more emission lines outside the visible region of the spectrum (uv, ir): n1 = 1, 2, 3, ….. n2 = n1+1, n1+2, … Ry = 3.29 x 10¹⁵ 1/s • This suggested that the energy levels of the H atom are proportional to 1/n2
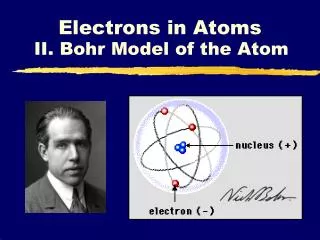
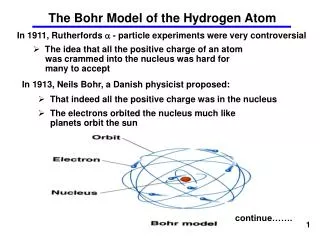
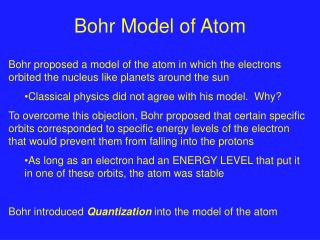
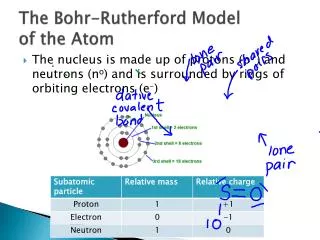
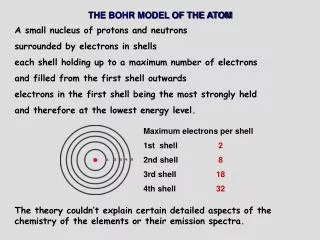
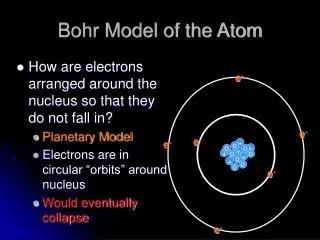
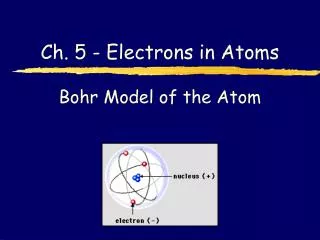
The Bohr Model • Niels Bohr uses the emission spectrum of hydrogen to develop a quantum model for H. • Central idea: electron circles the “nucleus” in only certain allowed circular orbitals. • Bohr postulates that there is Coulombic attraction between e- and nucleus (+). However, classical physics is unable to explain why an H atom doesn’t simply collapse, with the electron spiraling into the nucleus.
The Bohr model for the H atom is capable of reproducing the energy levels given by the empirical formulas of Balmer and Rydberg. Z = atomic no. (1 for H) n = integer (1, 2, ….) Note: Ry x h = -2.178 x 10⁻¹⁸ J
Energy levels get closer together as n increases for n = infinity, E = 0, so reference state is electron completely removed from the H atom.
We can use the Bohr model to predict what DE is for any two energy levels:
• Example: At what wavelength will emission from n = 4 to n = 1 for the H atom be observed? 1 4
• Example: What is the longest wavelength of light that will result in removal of the e- from H? 1
Extension to Higher Z • The Bohr model can be extended to any single electron system….must keep track of Z. Z = atomic number n = integer (1, 2, ….) Examples: He+ (Z = 2), Li+2 (Z = 3), etc.
• Example: At what wavelength will emission from n = 4 to n = 1 for the He+ atom be observed? 2 1 4 Note:
Where does this go wrong? • The Bohr model’s successes are limited: Doesn’t work for multi-electron atoms. The “electron racetrack” picture is incorrect. • That said, the Bohr model was a pioneering, “quantized” picture of atomic energy levels.