Download
1 / 61
630 likes | 937 Vues
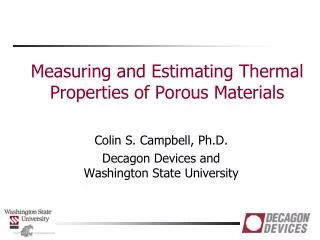
Doug Cobos and Gaylon Campbell Decagon Devices and Washington State University. Measuring and Modelling Thermal Properties of Porous Materials. Outline. Why measure thermal properties of materials Thermal properties definitions

E N D
Doug Cobosand Gaylon Campbell Decagon Devices and Washington State University Measuring and Modelling Thermal Properties of Porous Materials
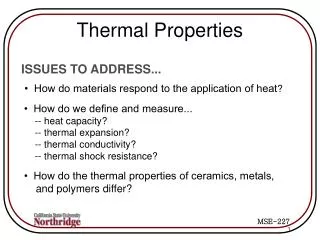
Outline Why measure thermal properties of materials Thermal properties definitions Ranges and behaviour with density, temperature and moisture Measurement methods Estimating thermal properties Modeling Interpolation Thermal properties on Mars
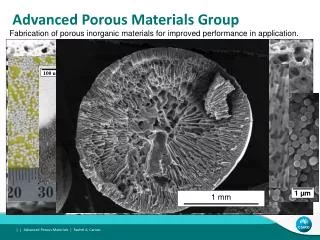
Interesting soil and geotechnical applications • Direct • Thermal resistivity of building materials • Surface energy balance • Geothermal (heat pump) exchangers • Buried power transmission lines • Burial of high level radio-active waste • Indirect • Water content of soil • Water content of construction materials (concrete)
Steady State Heat Flow: Fourier’s First Law H H - heat flux density W m-2 k - thermal conductivity W m-1 K-1 r - thermal resistivity oC cm-1W-1 T1 Dx T2
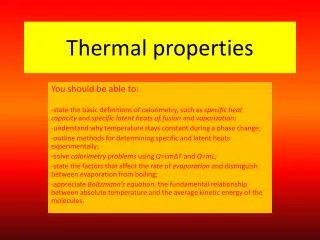
Steady State Thermal Properties • Thermal conductivity (k ) Ratio of heat flux density to temperature gradient – measures the amount of heat a material can transmit for a given temperature gradient • Thermal resistivity (r) Reciprocal of thermal conductivity – used mainly in buried power cable applications
Which is best, conductivity or resistivity? For soil, conductivity is almost always preferable to resistivity: • Better statistical properties • More correct for averaging • More linear with water content • A more correct perception of significance
An extreme example • Assume two materials of equal area, one with a conductivity of 1 and the other with a conductivity of zero. Resistivities would be 1 and infinity. • Averaging the conductivities would give ½. Averaging resistivities would give infinity.
Transient Thermal Properties • Volumetric specific heat (C ) Heat required to raise the temperature of unit volume by 1 K (or C): J m-3 K-1 (product of density and mass specific heat) • Thermal diffusivity (D ) Ratio of conductivity to heat capacity; measure of propagation rate of thermal disturbances: m2 s-1
Modeling Soil Thermal Properties • Soil is a mixture of solid, liquid (water) and gas (air and water vapor) • The thermal properties of the soil depend on the thermal properties of the constituents, their volume fractions, and how they are mixed
Thermal properties of constituents From Campbell and Norman (1998)
Calculating volumetric heat capacity The heat capacity of a mixture of air, water and solids is the sum of the volume fractions, each multiplied by its heat capacity where C is heat capacity x – volume fraction of the constituent s, w, and a refer to solids, water, and air
Volumetric heat capacity example For a mixture of 50% soil minerals, 25% air and 25% water the heat capacity is Note: water is half of total and air is insignificant
Volumetric heat capacity: main points Ranges from around 1 to 3 MJ m-3 K-1 Varies linearly with water content Easy to compute from water content and bulk density
Conductivity can’t be easily predicted from volume fraction heat heat air air min min Series Parallel 1/k = 0.5/2.5 + 0.5/0.025 k = 0.05 k = 0.5 x 2.5 + 0.5 x 0.025 = 1.26
Some consequences of thermally induced water flow • Unsaturated soil will dry out around heated objects • Thermal runaway in buried cables • Water migration away from buried nuclear waste • Take Home: Methods that heat the soil for long time periods can’t accurately measure conductivity of unsaturated porous media
Take-home Thermal conductivity of soil can range over more than an order of magnitude (0.1 to 2 W m-1K-1) Thermal conductivity of porous material depends on: Composition Temperature Density Water content
More Take-home If you want high conductivity (low resistivity): Compacted is good, fluffy is bad Wet is good, dry is bad Quartz is good, organic is bad For a wet soil, high temperature is good. For dry soil it doesn't matter.
Outline Thermal properties definitions Ranges and behaviour with density, temperature and moisture Measurement methods Estimating thermal properties Modelling Interpolation Thermal properties on Mars
Equations for single and dual line heat source Heating curve Cooling curve
Single needle inserted into soil and heated Temperature response measured at same needle Temperature (°C) Measurement of Thermal Conductivity –single needle heat pulse
Thermal conductivity: single needle method k proportional to 1/slope
Measurement of Heat Capacity - dual needle heat pulse q is heat input per unit length of needle (J/m) r is the distance between the needles ΔTm is the maximum temperature increase at the second needle tm is the time at which ΔTmoccurs **tm must be measured from the middle of heat pulse
Heated needles are transient line heat sources Ideally Source is infinitely long and infinitesimally small Temperature is uniform and constant Perfect thermal contact between needle and medium
Real sensors: not infinitely long or infinitesimally small 10 cm long, 2.4 mm diameter 6 cm long, 1.27 mm diameter 3 cm long, 6 mm spacing
Measurement problems for the line heat source Ideal • Source is infinitely long and infinitesimally small • Perfect thermal contact between needle and medium • Temperature is uniform and constant Reality • Source is 3 cm - 120 cm long • Contact resistance between needle and medium • Temperature may vary in space and time
Effect of finite needle size (30 s heating) • Thick needles must be heated longer for accurate measurements
Contact resistance • Poor thermal contact between needle and medium of interest • Dry soil or granular material • Solid materials with pilot hole • Thermal conductivity can be significantly underestimated if short heating times used • Longer heating times needed in these types of materials
Important points Small need with short heating time preferred if no contact resistance Must have longer heating time if: Larger needle used Dry or solid materials Temperature drift during measurement causes serious errors in heating-only analyses Must analyze heating and cooling data
How does the KD2-Pro address these issues? Heating time is optimized for needle size and material 30 s for small “liquids” needle 2.5 – 5 minutes for large “soil and solids” needle Measure both heating and cooling phases to remove effects of temperature drift Verify accuracy against known standards
Outline Thermal properties definitions Ranges and behaviour with density, temperature and moisture Measurement methods Estimating thermal properties Modeling Interpolation Thermal properties on Mars
Field measurements • A single measurement represents a point in time and is nearly worthless for design – huge dependence on water content • Continuously measuring thermal properties over a year or more will provide adequate information
How can we get a dryout curve? Use basic theory to model k as function of VWC Make measurements on a single sample as it dries Mix up multiple samples and make measurements on them
Dryout Curves - Modeling • Predict k as a function of water content, temp, compaction and composition • Apply model for desired temp • References • Bristow, K. 2002 . Thermal Conductivity, p1209-1226. Methods of soil analysis. Part 4. Physical Methods (Soil Science Society of America Book Series, Vol. 5). Soil Science Society of America. Madison, WI. • Campbell, G. S., J. D. Jungbauer, Jr., W. R. Bidlake and R. D. Hungerford. 1994. Predicting the effect of temperature on soil thermal conductivity. Soil Science 158:307-313.
Dryout Curves - Modeling • Advantages • Don’t have to take a lot of measurements • Useful for understanding the effects of: • Composition • Compaction • Temperature changes • Water content
Dryout Curves - Modeling • Disadvantages • No actual thermal resistivity measurements from specific sample • Have to know • Mineralogy • Compaction • Soil texture • Temperature • Lack of confidence in data
Dryout Curves – Single Sample • Core or repacked sample • Core for native materials • Repacked sample for backfill materials
Dryout Curves – Single Sample • Method • Saturate with water • Measurement taken • Weigh sample • Measurements over time (as sample dries) • Oven dry, then cool to room temp • Measure • Weigh • Water contents computed • Plot dryout curve
Dryout Curves – Single Sample • Advantages • No disturbance of soil (density stays constant) • But, the sample could crack • Good on fully wet and fully dry but…
Dryout Curves – Single Sample • Disadvantages • Samples don’t dry uniformly • Can be more than 50% error • Time intensive
Dryout Curves – Single Sample • Disadvantages (cont.) • Weight gives average water content not water content at the point of the thermal resistivity measurement