
Uploaded by
fern
1 SLIDES
138 VUES
10LIKES
Weekly Mean SWD Captured Per Trap in 2013 Bait Experiment
DESCRIPTION
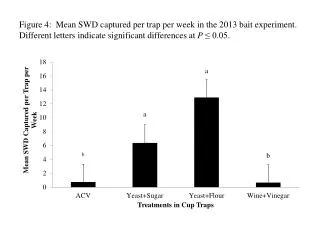
This figure illustrates the mean number of Spotted-Wing Drosophila (SWD) captured per trap each week during the 2013 bait experiment. The variation in captures is denoted by different letters, indicating significant differences at the P ≤ 0.05 level. This data is crucial for understanding the effectiveness of different bait strategies and SWD population dynamics over time, providing insights into pest management in agricultural practices.
Download
1 / 1
Télécharger la présentation 
Weekly Mean SWD Captured Per Trap in 2013 Bait Experiment
An Image/Link below is provided (as is) to download presentation
Download Policy: Content on the Website is provided to you AS IS for your information and personal use and may not be sold / licensed / shared on other websites without getting consent from its author.
Content is provided to you AS IS for your information and personal use only.
Download presentation by click this link.
While downloading, if for some reason you are not able to download a presentation, the publisher may have deleted the file from their server.
During download, if you can't get a presentation, the file might be deleted by the publisher.
E N D
Presentation Transcript
Figure 4: Mean SWD captured per trap per week in the 2013 bait experiment. Different letters indicate significant differences at P ≤ 0.05.
More Related
Audio
Live Player