Download
1 / 43
430 likes | 521 Vues
Explore the San Diego PECAS model for analyzing land use, transportation policies, economic flows, and space allocation. Learn about location choices, technology options, space development simulations, and economic performance analysis.

E N D
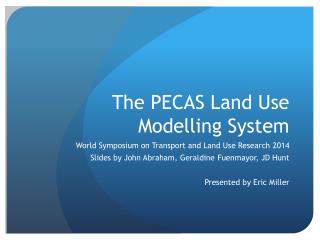
Investigating Land Use Regulation and Transportation Policy with the San Diego PECAS Model
Production Exchange Consumption Allocation System
Goods, Services, Labour and Space $ $ $ $ $ $ $ Producing Sectors $ $ $ $ $ $ $ $ $ Economic Flows $ $ $ $ $ $ Consuming Sectors $ $ $ $ $ $ $ $ $ $ $ $ $
Goods, Services, Labour and Space commodities $ $ $ $ $ $ $ Producing Sectors $ $ $ $ $ $ $ $ $ activities Economic Flows $ $ $ $ $ $ Consuming Sectors $ $ $ $ $ $ $ $ $ $ $ $ $
Household activities • Produce labour • Consume goods, services, residential space Business, government, and not for profit activities • Produce goods or services (usually one type) • Consume goods, services, labour and nonresidential space
Just 5 Choices 1: Where to locate 2: What to make and what to consume in the process (called the ‘technology’ to use) 3: Where to buy what is consumed and where to sell what is made 4: What type of space (floorspace, buildings) to build 5: How much space to build The interactions among these
PECAS AA Choice Model (Additive logit model) Location Choice location alternatives; building with local and neighbourhood attributes Technology Choice technology options; vectors of the make and use of items, production processes for establishments and lifestyles for households Buying and Selling Exchange Choice exchange locations; where the seller stops and the buyer starts paying for transport
Space Development: Simulation of Transitions
Space Development: Simulation of Transitions parcel-by-parcel microsimulation
no change more the same mid density residential commercial industrial derelict quantity Space Development: Simulation of Transitions parcel-by-parcel microsimulation
no change more the same mid density residential commercial industrial derelict quantity Space Development: Simulation of Transitions parcel-by-parcel microsimulation zoning dictates set of alternatives
Nested logit structure New space type Add space No change Demolish Derelict multi-level nested discrete-continuous logit Quantity Quantity
Treatment of Space parcel or grid cell site
Treatment of Space transport analysis zone (TAZ)
Treatment of Space land use zone (LUZ)
SANDAG PECAS ModelApplication: Background • San Diego Association of Governments • Built and calibrated the model • Iterative approach, starting in 2007 • Production-ready and development work streams last few years, completed 2012 • Sensitivity tests and policy analysis • Now using in formal forecasting process #ITM2014
SANDAG PECAS ModelApplication: Model Design • Standard PECAS Framework • 46 Activity Types, ~ 9 Household Categories • 85 Commodity Categories, ~ 7 Labor and 35 Space Types • 236 Land Use Zones • 2005 to 2012 for calibration; 2012 to 2050 for forecasting • 4-Step Transport Model every 3 years starting 2005 • Rent Smoothing, Construction Control #ITM2014
PECAS SANDAG Original Motivations • Focus on redevelopment potential • Not enough capacity though new development • Force thoughtful consideration of different redevelopment possibilities • Add economic performance analysis to existing forecasting • Consumer benefit measures • Travel costs are not a good measure of transportation system performance • Represent economic interactions • Greater insight into why location and technology/lifestyle choices are made #ITM2014
Zoning and capacity Zoning Capacity Parcel-by-parcel review by SANDAG and local planners Envisioned full build-out development on each parcel “Planned” development type, and count of residential units Reflects historical agreement as to regional vision • Permissions that constrain SD • Developed through review of published regulations • SANDAG interns guided by demographers/modelers, ~2009 • Allowed uses • Allowed intensities (FAR) • Each local government
Zoning and capacity • Initial model runs showed developer profit potential of being allowed to build legally allowed projects at legally allowed intensities. • Initial purpose of the model • Felt to be too radical, official planning process (at least for RTP) needed to reflect trends and past agreements • “Capacity” added to model, for forecasting purposes.
PECAS SANDAG Application: Background Sensitivity Tests Scenarios • s21: Reference • s22: HH LUZ Capacities Removed • s23: HH LUZ Capacities Removed; Veh Costs x 3 • s24: HH LUZ Capacities Removed; Dev Fees = 0 • s25: HH LUZ Capacities Removed; Transit Freq x 3
(S21) (S22) (S23) (S24) (S25)
Removing Household Capacities 150kplus 3+ households
Removing Household Capacities Under25k 3+ households
Vehicle Costs X3 150kplus 3+ households
Implications • Forecasting system • But beware: are you ready to let go of your previous forecasts? • And, are you retiring or changing jobs soon? • If not, consider constraint or capacity system • Negotiated build-out scenario may not be very economically efficient • Zoning may be more permissive than you think • Or less permissive than it seems
Implications • All our travel infrastructure and service plans may be having marginal effects on regional livability (consumer surplus), when compared to strong land use planning visions • Behavioral spatial economic modeling may indeed force thoughtful consideration of policy • Success! (by original definition…) • RTP forecasting is different than policy analysis and consensus forecasting • Can contain limited elements of each • But strict timeline and process requirements