Download
1 / 76
760 likes | 926 Vues
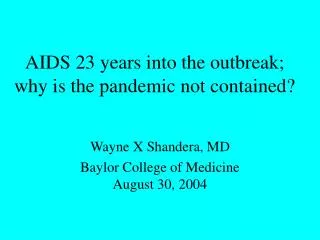
AIDS 23 years into the outbreak; why is the pandemic not contained?. Wayne X Shandera, MD Baylor College of Medicine August 30, 2004. Topics to be covered. 1 The current epidemiology of HIV/AIDS Unique problem areas of the world today 2 Pathogenesis of disease

E N D
AIDS 23 years into the outbreak;why is the pandemic not contained? Wayne X Shandera, MD Baylor College of MedicineAugust 30, 2004
Topics to be covered 1 The current epidemiology of HIV/AIDS Unique problem areas of the world today 2 Pathogenesis of disease The impact of simple models Modeling the coreceptor phenomenon • Treatment and prevention How can resistance or adherence better be studied? Does governmental policy make a difference? • Need for interactions today mathematicians, virologists, and physicians
1 - Epidemiology • A study of the unexpected (knowing the denominator) • In 1981 Pneumocystis pneumonia or Kaposi’s sarcoma among homosexual men was unexpected • These are opportunistic infections which developed because of HIV (isolated, 1983) infection • In 23 years the prevalence of HIV infection increased from zero to 1 in 150 globally • Profound demographic impact in some cultures
HIV Prevalence in Adults, end 2003, 38 million infected 40 million in a world with 6 billion: 1/150
Sub-Saharan Africa • About 90% of HIV-infected Africans do not know that they are infected • Only about 11% of the HIV-infected have been tested • The percentage of Africans on HAART is clearly under 1%
Why is Southern sub-Saharan Africa so impacted? • Viral factors? • Host factors? • Transmission determinants?
Viral factors • Transfer of a simian virus, separately for HIV-1 and HIV-2, probably through hunting accidents • HIV-2 from sooty mangabees in West Africa • HIV-1 from chimpanzees in Central Africa • Unique clades for southern sub-Saharan Africa may explain its meteoric rise there?
The HIV prevalence saw its exponential growth among CSWs in Africa after it was already prevalent among homosexual men in the US
HIV types (clades): Red is A, Green is B, Blue is C Isolates are most diverse where the virus was present the longest Type C virus shows unique properties that may explain some added pathogenicity
Clade distribution within Africa In Cameroon, 40% of isolates are nonrecombinant forms, making vaccine production more difficult
Host factors • Human immunogenetic determinants to some degree affect progression of disease • Are there unique such determinants in southern Africa? This needs modeling! • The age of first marriage may be important • Concomitant sexually transmitted diseases put one at higher risk for infection with HIV • Lack of circumcision does the same • Circumcision rates correlate in one study (at +0.9, Pearson correlation coefficient) with absence of HIV
We know that age of marriage is important because: • It correlates directly with the age of first child (which is the best correlate of population growth)
In the most HIV-impacted African countries, marriage occurs later • Three of the African nations with the highest HIV rate are at the bottom of this table, suggesting that age at marriage is not the primary factor for spread in southern sub-Saharan Africa
Do transmission factors explain the HIV rise in Southern Africa? • Poverty • Literacy • Women’s education • Migration of peoples • Political factors and degree of corruption • Inappropriate use and reuse of contaminated needles
Is there a correlation between poverty and AIDS? • Because most sub-Saharan African countries are poor, it is difficult to find sufficient variation to study this relationship • Namibia and Botswana are heavily impacted with HIV infection, yet their per capita gross national income (GNI) and per capita purchasing power parity (PPP) are among the highest in Africa
per capita Purchasing Power Parity for sub-Saharan Africa nations • 1 Luxembourg $48,560 • 2 United States $34,280 • 64 South Africa $10,910 • 70 Mauritius $ 9,860 • 84 Botswana $ 7,410* • 85 Namibia $ 7,410 • 118 Swaziland $ 4,430* • 139 Lesotho $ 2,980* • 156 Zimbabwe $ 2,220* • 205 Congo, DR $ 630 • 208 Sierra Leone $ 460
What about literacy in sub-Saharan Africa? A moderate correlation, but HIV prevalence appears to be higher in countries that show higher literacy Could this reflect poor surveillance in the less literate nations?
Ted Conover, "The Road Is Very Unfair: Trucking Across Africa in the age of Aids“New Yorker, Aug 16, 1993 Along the remote routes of eastern Africa, long-distance truck drivers have been affectionately revered as cowboys in convoy. But now they are also identified as the unwitting carriers of AIDS, particularly in Rwanda, at the heart of the AIDS belt, where their H.I.V. infection rate is fifty-one per cent
A truck in Mali that traverses the migratory routes and spreads a message of HIV prevention to 16,000 persons along its routes
Other worrisome foci in the world today • Eastern Europe especially among drug users • China and India • 40% of the world’s population • India already may have the largest case load • Southeast Asia • A diverse outbreak, IVDU and CSWs • Cambodia with 4% and highest prevalence
Is Texas exempt in the era of combination therapy? The changes in prevalence are worrisome
What models describe the outbreak at large? • May and Anderson, compartmental models • Importance of mixing among subgroups • Size of outbreak assessed by back calculation • use of convolution • Incubation period (t, exposure to disease) is a bugaboo: • Highly variable • Infectivity is high early in disease, low, then high, hence when does disease actually begin?
Isham V, Stochastic models for epidemics with special reference to AIDS Ann Appl Prob 1993;3:1. • Stochastic vs deterministic models • Acquiring infection is stochastic • Consequences of infection are both deterministic and stochastic • How do you accounting for variability in • sexual activity • incubation period • infectivity
Phenomenon of mixing The ideal? The reality
How do you account for mixing I sexual activity? • Xi(t) = # susceptibles in i subgroup • Yi(t) = # infected in i subgroup • κi = rate of partner change in i subgroup • pij = mixing matrix that partner in subgroup i will choose partner in subgroup j • β = transmission probability • ni = number of individuals in I subgroup Rate of infections in subgroup i = β Xi κi Σ pij Yj/nj
Incubation period for AIDS • Truncated on the left at time of infection • Interval to development of AIDS • Best modeled with • Weibull or • gamma distribution • scale ~2.6 Example of gamma distributions
Isham: divide the outbreak into i periods of differing infectivity (3)
Practical tools for epidemiologists • AIDS Impact Model (AIM) – incidence, progression and fertility to make demographic predictions for a give country (SPECTRUM) • Epimodel – uses point prevalence, assumptions about progression rates and putative start of outbreak to calculate incidence curves, used by UN
Practical tools (continued) • iwgAIDS – “complex continuous simulation” , calculate incidence and deaths by age and sex, modes of transmission, US Census Bureau models • Both Epimodel and iwgAIDS treat HIV+/-infected as separate entities, limiting demographic predictions • SimulAIDS – age structured “microstimulation” model of AIDS using full complement of variables (coital frequency, condom usage, # sex partners, frequency of sexually transmitted infections) to assess transmission dynamics
Practical tools (continued) • May and Anderson compartmental models • Demographic predictions • Aimed primarily at affect on heterosexual populations in developing world • Importance of Ro, the basic reproductive rate which must be >1 to sustain an outbreak • STDSIM – a Monte Carlo model of sexual transmission of HIV and 4 sexually transmitted diseases
β c Ro = (μ + v) β = probability of acquiring infection from infected person c = average rate of acquiring sexual contacts μ = underlying mortality v = disease-assd mortality Ro = reproductive rate of the outbreak
Is Ro < or > 1? • The primary drive is to push Ro< 1 • Is this best done through decreasing β? • Condoms • HAART • Is this best done through decreasing c? • Sexual education, religious based programs • Increasing v is not a good alternative • A reminder that patients living longer may sustain the outbreak • Boily et al: Changes in transmission dynamics of the HIV epidemic after the wide-scale use of antiretroviral therapy could explain increases in sexually transmitted infections. STD 2004;31:100
Criteria for a good model • Good fit to observed data • Reasonable biological interpretation • Conceptual and computational simplicity • Applicability to low-quality, less frequent data • Convenient for statistical inferences, interpretation • Low costs economically and computationally Courtesy, Wu and Ding, Biometrics 1999;55:418
Pathogenesis (how disease develops) • Challenge in the mid-1990s to the prevailing idea of how AIDS is maintained during its “years of latency” • Models that incorporate new biologic findings on coreceptor usage • HIV binds to a cell receptor (CD4) but also requires a coreceptor (“CCR5”) in which the deletion of a segment provides complete protection from infection
Early simple models • Data of Ho et al, Wei et al, challenged the prevailing notion of viral dynamics • Modeled the level of actively replicating virus in blood after administering a protease inhibitor (which inhibits final viral particle production) • Best fit was a negative log function
During years of “latency”, is the virus quiescent or replicating? Source: Alimonti, J Gen Virol 2003
Math formulation • V(t) = V(0)e-St • where S is the slope from the previous graph • V(t1/2) = V(0)/2 = V(0)e-S(t1/2) • t1/2 = ln(2)/S • S = -0.34 (range, -0.21 to –0.54) • t1/2 = 2.04 days (range, 1/3 – 3.3 days)
Consequence of these data • Recognition that HIV is not merely virally stagnant within a sequestered site (such as the herpes viruses within neurologic tissue) • Instead 109 particles are produced daily • Therapy was hence changed from single agents (which began in 1987) to multiagent, combination therapy in the mid-1990s • HAART: Highly Active Anti-Retroviral Therapy
Some reservoirs show a half-life of months, making eradication next to impossible by current therapy, Ho, Science, 1998, 1866
Another aspect of pathogenesis that has been modeled • Infection is a consequence of virus/host cell interactions • The main interaction is between viral glycoprotein 41 (gp41) and a cellular determinant (CD4) receptor • A second “co-receptor” is required for virus/host cell interaction