Download
1 / 57
580 likes | 744 Vues
Human Development within Planetary Boundaries. Planetary Boundaries: Challenging Environmental Ortodoxies Pugwash Conference London 6th July 2011. Prof. Johan Rockström Stockholm Resilience Centre Stockholm Environment Institute. Growing Human Pressure [20/80 dilemma]. Ecosystem decline

E N D
Human Development within Planetary Boundaries Planetary Boundaries: Challenging Environmental Ortodoxies Pugwash Conference London 6th July 2011 Prof. Johan Rockström Stockholm Resilience Centre Stockholm Environment Institute
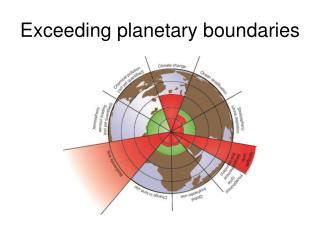
Growing Human Pressure [20/80 dilemma] Ecosystem decline [60 % loss dilemma] Climate change [560/450/400 dilemma] Surprise [99/1 dilemma]
Humanity has reached a planetary saturation point • A resilient biosphere the basis for humen development • It is not only about climate change • A great transformation to global sustainability necessary, possible, and desirable
Rio+20 and Planetary Boundaries UN Secretary General Ban Ki-Moon High Level Panel on Global Sustainability
Atmospheric CO2 concentration Etheridge et al. Geophys Res 101: 4115-4128 IGBP synthesis: Global Change and the Earth System, Steffen et al 2004
Northern hemisphere average surface temperature Mann et al Geophys Res Lett 26(6): 759-762 IGBP synthesis: Global Change and the Earth System, Steffen et al 2004
Atmospheric N2O concentration Machida et al Geophys Res Lett 22:2921-2925 IGBP synthesis: Global Change and the Earth System, Steffen et al 2004
Atmospheric CH4 concentration Blunier et al J Geophy Res 20: 2219-2222 IGBP synthesis: Global Change and the Earth System, Steffen et al 2004
Ozone depletion JD Shanklin British Antarctic Survey IGBP synthesis: Global Change and the Earth System, Steffen et al 2004
Natural climactic disasters IGBP synthesis: Global Change and the Earth System, Steffen et al 2004
Ocean ecosystems FAOSTAT 2002 Statistical database IGBP synthesis: Global Change and the Earth System, Steffen et al 2004
Coastal zone nitrogen flux Mackenzie et al 2002. IGBP synthesis: Global Change and the Earth System, Steffen et al 2004
Tropical rainforest and woodland loss Richards, the Earth as transformed by human action, Cambridge University Press IGBP synthesis: Global Change and the Earth System, Steffen et al 2004
Domesticated land Klein Goldewijk and Batties IGBP synthesis: Global Change and the Earth System, Steffen et al 2004
Species extinctions Wilson, the Diversity of Life. IGBP synthesis: Global Change and the Earth System, Steffen et al 2004
Valuable Ecosystem Services Loss of ecosystem services (Desirable) (Undesirable) 1 4 coral dominance clear water grassland algal dominance turbid water shrub-bushland state shift 2 3 • overfishing, coastal • eutrophication • phosphorous accum- • ulation in soil and mud • fire prevention • disease, • hurricane • flooding, warming, • overexploitation • of predators • good rains, continu- • ous heavy grazing
Regime shifts in all systems Bothnian Bay (BB) Gulf of Finland (GF) A. Sorteberg, University of Bergen, Norway", data from Snow & Ice Data Center, Boulder CO, USA BB Bothnian Bay (BS) BS GF The Sound (TS) GR Gulf of Riga (GR) CBS TS Central Baltic (CBS) Sub-system specific indices of ecosystem development (PC1 from PCA) Regimes identified using STARS on PC1s (red lines) Almost synchronous regime shifts in all sub-systems Torsten Bleckner et al., 2009
Tipping elements in the Earth system – PNAS Special Feature released December 2009 PNAS Special Feature: Tipping elements in the Earth System, Jan 2010, vol 106 (49)
Planetary Boundaries: Exploring the safe operating space for humanity in the Anthropocene (Nature, 461 : 472 – 475, Sept 24 - 2009)
PB concept rests on three branches of Scientific inquiry • Earth System and sustainability science (Understanding Earth System processes; ICSU, IGBP, ESSP, IPCC, MEA, evolution of sustainability science…) • Scale of human action in relation to the capacity of the planet to sustain it (Kenneth Boulding Spaceship Earth, Herman Daly, Club of Rome, Ecological Economics reserach agenda, Ecological Footprint...) • Shocks and Abrupt change in Social-Ecological systems from local to global scales • (Resilience, GAIA, tipping elements, guardrails...) Planetary Boundaries concept
From: ”Limits to growth” ”Carrying capacity” ”Guardrails” ”Tipping Elements” To: ”Planetary Boundaries”
Two different types ofplanetary boundary processes 1. Critical continental to global threshold 2. No known global threshold effect
Climate Change < 350 ppm CO2 < 1W m2 (350 – 500 ppm CO2 ; 1-1.5 W m2) Ozone depletion < 5 % of Pre-Industrial 290 DU (5 - 10%) Biogeochemical loading: Global N & P Cycles Limit industrial fixation of N2 to 35 Tg N yr-1(25 % of natural fixation) (25%-35%) P < 10× natural weathering inflow to Oceans (10× – 100×) Atmospheric Aerosol Loading To be determined Planetary Boundaries Ocean acidification Aragonite saturation ratio > 80 % above pre-industrial levels (> 80% - > 70 %) Global Freshwater Use <4000 km3/yr (4000 – 6000 km3/yr) Rate of Biodiversity Loss < 10 E/MSY (< 10 - < 1000 E/MSY) Land System Change ≤15 % of land under crops (15-20%) Chemical Pollution Plastics, Endocrine Desruptors, Nuclear Waste Emitted globally To be determined
Transgressing safe boundaries Global fresh- water use … Rockström et al. 2009Nature, 461 (24): 472-475
Rate of Biodiversity LossAvoid large scale irreversible loss of functional diversity and ecological resilience The current and projected rate of biodiversity loss constitutes the sixth major extinction event in the history of life on Earth – the first to be driven by human activities on the planet Biodiversity plays a key role for functional diversity and thereby ecosystem resilience Humans have increased the rate of species extinction by 100-1,000 times the background rates that were typical over Earth’s history Average global extinction rate projected to increase another 10-fold, to 1,000-10,000 E/MSY during the current century
Biodiversity LossSetting the boundary: Suggesting a safe planetary boundary (here placed at 10 E/MSY) within an order of magnitude of the natural background rate
Land System ChangeAvoid unsustainable land system change predominantly from intensive agricultural use Threat to biodiversity and undermining of regulatory capacity of ecosystems Setting the boundary: No more than 15 % of the global ice-free land surface should be converted to cropland (12% today)
Land use change Agriculture ~35 % of the planets terrestrial land area
Global Freshwater UseAvoid water induced environmental change at regional scale Humans now alter global runoff flows, through withdrawals of blue water, and changes in green water flows, affecting water partitioning and moisture feedback Physical water scarcity when withdrawals exceed 5000 – 6000 km3 yr-1 Final availability of runoff determined by consumptive use of green and blue water flows Consumptive use of blue water an aggregate control variable with boundary set at < 4000 km3 yr-1
Blue Water Resources Stressed m3 blue water/person/year m3 green water/person/year Siebert et al., 2009
Biogeochemical flows: Human interference with global N cycle Local to regional scale interference with N and P flows has pushed aquatic and marine systems across thresholds generating abrupt non-linear change Human modification of the nitrogen cycle is now profound (converting more N2 from the atmosphere into reactive forms than all of the Earth’s terrestrial processes combined) N and P slow variables eroding resilience of important sub-systems of the Earth system.
Biogeochemical flows: Human interference with global P cycle The crossing of a critical threshold of P inflow to the oceans could explain global-scale ocean anoxic events (OAE), and past mass extinctions of marine life A boundary level should be set that (with current knowledge) allows humanity to safely steer away from the risk of triggering an OAE even over longer time horizons (> 1,000 yrs)
Biogeochemical flows: Setting the boundary Nitrogen: return to 25 % of the current human fixation of N2 from the atmosphere. Phosphorus: Anthropogenic P inflow to the ocean is not allowed to exceed a human induced level of ~10 times the natural background rate of ~1 Mt P yr-1.
Ozone depletionAvoiding the risk of large impacts for humans and ecosystem from thinning of extra-polar ozone layer Antarctic ozone depletion a classic example of an unexpected crossing of a threshold Identifying a threshold remains uncertain a less than 5% decrease in column ozone levels for any particular latitude
Chemical PollutionSteer away from irreversible impacts on living organisms Global, ubiquitous impact on the physiological development and demography of humans and other organisms with ultimate impacts on ecosystem functioning and structure By acting as a slow variable that affects other planetary boundaries (e.g., rate of biodiversity loss) 2 complementary approaches: amounts of persistent pollutants with global distribution (e.g., mercury); Effects of chemical pollution on living organisms Difficult to find an appropriate aggregate control variable. Close interactions with Aerosol loading; may require sub-boundaries based on sub-impacts/categories of chemicals
Atmospheric Aerosol LoadingAvoid major influence on climate system and human health at regional to global scales Human activities have doubled the global concentration of most aerosols since the pre-industrial era Influence on the Earth’s radiative balance May have substantial implications on hydrological cycle and, e.g., Asian monsoon circulation Fine particle (PM2.5) air pollution Processes and mechanisms behind these correlations remain to be fully explained
Already Committed Global Warming (Ramanathan et al. 2009)
Climate Changewhat is required to avoid the crossing of critical thresholds that separate qualitatively different climate system states We suggest boundary values of 350 ppm CO2 and 1 W m-2 above pre-industrial level
350 550