Download
1 / 29
290 likes | 440 Vues
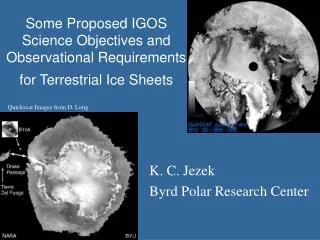
Some Proposed IGOS Science Objectives and Observational Requirements for Terrestrial Ice Sheets. Quickscat Images from D. Long. K. C. Jezek Byrd Polar Research Center. Glaciers and Ice Sheets ‘Grand Challenges’.

E N D
Some Proposed IGOS Science Objectives and Observational Requirements for Terrestrial Ice Sheets Quickscat Images from D. Long K. C. Jezek Byrd Polar Research Center .
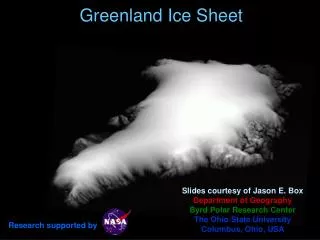
Glaciers and Ice Sheets ‘Grand Challenges’ • Understand the polar ice sheets sufficiently to predict their response to global climate change and their contribution global sea level rise • What is the mass balance of the polar ice sheets? • How will the mass balance change in the future? • How do changes in the cryosphere affect human activity?
Mass Balance • Ice sheet mass balance is described by the mass continuity equation Altimeters Act/Pass. Microwave InSAR No spaceborne technique available Evaluations of the left and right hand sides of the equation will yield a far more complete result
Ice Dynamics and Prediction Force Balance Equations No Sat. Cover Satellite Altimetry Basal Drag, Inferred at best Terms related to gradients in ice velocity (InSAR) and temperature integrated over thickness Understanding dynamics coupled with the continuity equations yields predictions on future changes in mass balance
An IGOS Goal • Extend local observations of ice sheet physical properties to realize a continent wide understanding of ice dynamics, mass balance and the interaction of the ice sheets with other global systems
IGOS and ’07 IPY Snapshots From Space Goal: Advance polar science by providing a benchmark data set of continental scale geophysical products Objective: Develop and execute an international plan for coordinated spaceborne observations of the polar regions and polar processes Balance Velocity (Wu and Jezek, 2005) Rignot and Thomas (2002) Approach: Concentrate resources on science questions best addressed by a 'snapshot' approach and/or which benefit from creation of a single, integrated data set
Petermann Gl. Measurement Objectives 1962 DISP (Zhou and Jezek,2002) Objectives geared to establishing benchmark measurements of properties and processes: • Ice Sheet Change Detection Studies: Hi-resolution image maps of the polar ice sheets (optical and microwave) • Ice Sheet Mass Balance: Accumulation rate fields from passive and active microwave; surface velocity from SAR and feature retracking • Ice Sheet Dynamics: Stress and strain rate fields from altimetric surface topography and SAR velocity; surface temperature fields from medium resolution THIR • Ice-Sheet Ocean Interactions: Fresh water fluxes from ice shelves from SAR velocity and ice thickness supplemented from altimeters (isostasy); Relationships to sea ice concentration and extent from passive microwave. Annual Accumulation In Central Greenland from SMMR (Bolzan and Jezek, 1999)
AMM-1 Ice Sheets Key Measurements: • Map ice sheet geography (coastlines, grounding lines) • Measure surface topography • and changes in topography • Measure the surface and internal temperature • Measure the surface and basal accumulation rate and changes in accumulation rate patterns • Measure the surface velocity field and changes in velocity field patterns • Map the internal velocity field • Map internal structures (bottom crevasses, buried moraine bands, brine infiltration layers) • Map the basal topography of Antarctica and Greenland • Determine basal boundary conditions from radar reflectivity Liu and Jezek, 2004
Measure ice thickness to an accuracy of 10 m Measurements every 1 km Measure ice thickness ranging from 100 m to 5 km Measure radar reflectivity from basal interfaces (relative 0.5 dB) Ice thickness and Basal Conditions:An Unresolved Problem Measure internal layers to about 20 m elevation accuracy Pole to pole observations; ice divides to ice terminus One time only measurement of ice thickness Repeat every 5-10 years for changes in basal properties NEW TECHNOLOGY REQUIRED
IGOS and Approaches for Acquiring Data • Dedicated, customized data acquisition periods outside the scope of an existing mission profile (e.g. SAR mapping) • Procurement of large, customized data set from vendors (e.g. Quickbird images) ERS SAR Bolzan and Jezek, 2000 Fahnestock and others, 1993 • Specialized processing of routinely acquired data (e.g. accelerated processing of passive microwave products for incorporation into integrated data set) Accumulation from SSMI
The Particular Problem of SAR and IGOS RAMP and RGPS are illustrations of issues that IGOS might face in terms of resource allocation and data volumes Involved multiple flight agencies Utilized spacecraft and ground segment capabilities for defined period of time Required international cooperation Required coordination of flight operations and science requirements Other examples of international, large scale programs include Boreal Forest Mapping, Amazon Rain Forest Mapping, and these may offer valuable lessons.
Historical PerspectiveEuropean Remote Sensing Satellites -1/2 • Program for International Polar Oceans Research(PIPOR) • ERS-1/2 coverage of the Arctic Ocean for sea ice and polar ocean studies • Collaboration established by NASA investment in ASF, conceived to extend the reach of ERS coverage to the north pole. • Later extended to include coverage over Southern ocean via McMurdo Ground Station • Tandem mission provided interferometry data for ice sheet velocity measurements.
Radarsat -1 • NASA and the CSA conducted negotiations in the early 1980’s for use of Radarsat-1 • Negotiations provided access to science data (e.g. ADRO, Arctic Snapshot), data to the Joint Ice Center and provision for two, complete mappings of Antarctica • In exchange, NASA launched Radarsat-1 • Radarsat Geophysical Processor System: Arctic Snapshot obtained continuously since 1996. • 3-day sampling of sea ice motion and deformation along with derived properties
Radarsat-1 • 1997, first Antarctic Mapping Mission (map and InSAR) • 2000, modified InSAR mission to measure surface velocity • 2004 InSAR acquisitions to acquire data over scientifically interesting areas.
Project Lessons • Working relationships between PIPOR, ESA and NASA resulted in 8 minutes of SAR data per day becoming 30-40 minutes per day. Mutual desire to use the satellite and the early limitation of direct downlink meant that NASA through ASF was well positioned to acquire vastly more data than were originally anticipated. • RAMP and RGPS showed that a formal agreement established early in a mission plan resulted in voluminous data acquisitions. • RAMP and RGPS required extended and detailed interactions by the science community (PI) with the flight agencies to accomplish the goals. • Role of commercial groups in the data path and unrestricted use of science data remains a discussion point.
MODIS 2002 Larsen I.S. Strategic Lessons • Cryospheric science has benefited from pre-arranged agreements, polar ground stations, data management facilities. • Flight agencies and the science community have devised strategies for acquiring large volumes of SAR data through international partners • Successful arrangements required that flight agencies, such as NASA, enter into negotiations with partner flight agencies early in the project • Science community must be intimately involved in all aspects of the planning and execution of large campaigns • The role of the commercial sector is still being defined
Outstanding Issues for IGOS • Existing Archives and Data Systems • Overall pretty good for polar regions. Issues associated with timely data access, cost AND data and metadata from past and current in situ measurements. • Encourage more access to digital data via pointing tools such as GCMD • SAR Time series • Planned SAR systems such as Radarsat-2 and TerraSAR X could begin to build time series of observations BUT No approved SAR missions beyond 2011! • SAR Velocity Control • SAR velocity data are being controlled using in situ data from multiple epochs. This will eventually make velocity comparisons difficult. • Role of commercial data vendors in IGOS
IGOS and IPY '07 are important next steps that can: • build on a strong legacy of polar science • establish an essential benchmark for gauging changes in polar systems • further our understanding of how polar processes are intertwined with those of the rest of the globe Summary Captain Ashley McKinley holding the first aerial surveying camera used in Antarctica. It was mounted in the aircraft ‘Floyd Bennett’ during Byrd’s historic flight to the pole in 1929. (Photo from The Ohio State University Archives)
PRELIMINARY SET OF PRODUCT OBJECTIVES FOR IPY. Image Map/Mosaic Products Data Type Sensor Spatial Coverage Temporal Coverage POC Hi-res radar (C-Band) Radarsat 2/Envisat Complete polar ice sheets and glaciated terrain Spring and Summer image TBD Hi-res radar (L-band) Palsar ‘ ‘ Summer and spring images TBD Med Res radar Scatterometer ‘ ‘ monthly TBD Hi-Res optical ASTER ‘ ‘ Spring and Summer image TBD Hi Res multispectral LANDSAT7 ‘ ‘ Spring and summer image TBD Medium Res multispectral Terra/Aqua MODIS “ Seasonal TBD Passive microwave SSMI,Aqua AMSR-E ‘ ‘ Daily TBD NIR, THIR NOAA/NPOES, Aqua MODIS and AIRS ‘ ‘ Daily TBD Preliminary Set of Map Products
Radar altimeter elevation Cryosat ‘ ‘ Repeat cycle TBD Laser Altimeter Elevation IceSAT ‘ ‘ Repeat cycle TBD Surface Velocity All SARs ‘ ‘ Summer and winter set TBD Accumulation rate Radarsat, Envisat, SSMI ‘ ‘ Monthly or as available TBD Melt extent Radarsat/Envisat/SSMI ‘ ‘ Monthly or as available TBD Ice margin locations SARS and hi res visible ‘ ‘ Spring and Summer TBD Sea ice concentration SSMI, AMSR-E “ Daily TBD Preliminary Derived Products List
RADARSAT-1, CSA RAMP as a Model • RAMP is one illustration of how • project could be organized. • Involved multiple flight agencies • Utilized spacecraft and ground • segment capabilities for defined period of time • Required international cooperation • Required coordination of flight operations and science requirements • Other examples of international, large scale programs include Boreal Forest Mapping, Amazon Rain Forest Mapping, and these may offer valuable lessons.
Data Reception MGS PSS GSS ASF ASF Quick Look Support CSA Satellite Operations Orbit Dynamics (Quick-look, L0, SRFs, DQM) DSN Orbit Determination Data JPL Orbit Maintenance Plan and Baseline analysis Science Team Validation JPL Coherence Validation ASF Coverage and Coherence Validation AMPG ERIM/NIMA OSU Science Liaison CSA OSU Coverage Validation Vexcel Coherence Validation NASA HQ/GSFC Project Management AMM-2 Acquisition Phase Organization Mission Planning ASF Mission Planning and Conflict Resolution CSA Mission Planning GSFC WFF WS JPL Mission Plan JPL/OSU Replanning Team TDRSS/DOMSAT ASF Science Tool Development
Flight Agency 1 Flight Agency 2 Flight Operations Flight Operations Ground Segment Ground Segment System 1 System 2 Lead investigator Lead investigator IPY Steering Committee Science Team Science Team In Situ Campaigns Product to data center Product to data center Aqua, NASA ALOS, NASDA IPY Approach Cryosat, ESA
Some Practicalities • access time and coverage • repeat cycle (modified and coordinated with other instruments) • imaging/data collection modes (e.g. beam combinations) • scheduling (e.g. contemporaneous SAR and optical mapping) • orbit maintenance (minimize disruptions during coordinated acquisition activities) • duty cycle (intense observations during an IPY window) • coordinated/optimized mission planning - develop mission planning and mission monitoring tools RAMP Acquisitions, JPL MODIS, 2002 Larsen Ice Shelf