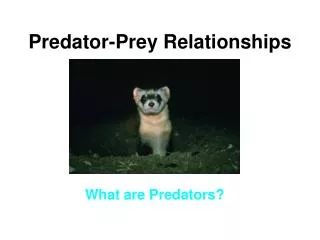
Predator vs. Prey
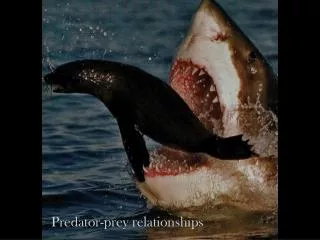
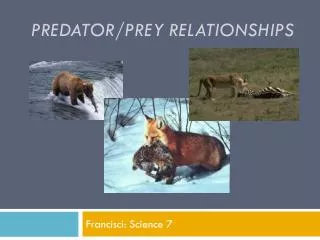
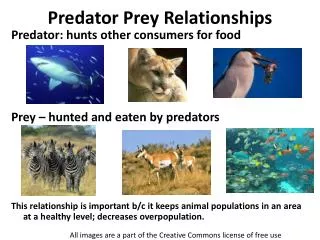
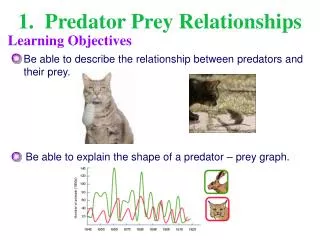
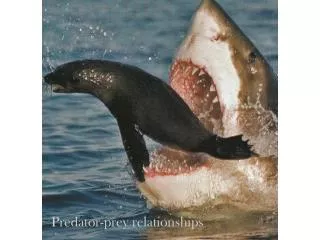
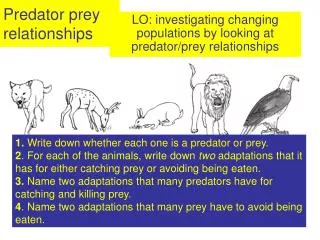
Predator vs. Prey. p rey impacts predator population more. h unters kill 500,000 deer/year. p redators switch prey instead of starve. Act. 1 – lynx and hare Act. 2 – pike and perch. Population density/distribution (14.3, pgs. 436-439).

Predator vs. Prey
E N D
Presentation Transcript
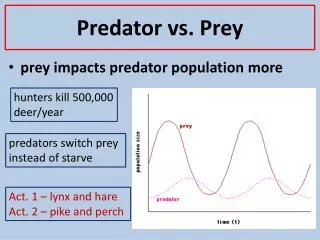
Predator vs. Prey • prey impacts predator population more hunters kill 500,000 deer/year predators switch prey instead of starve Act. 1 – lynx and hare Act. 2 – pike and perch
Population density/distribution(14.3, pgs. 436-439) population density– how many organisms live in a defined area
clumped dispersion uniform dispersion random dispersion Population density/distribution(14.3, pgs. 436-439) population dispersion– how the population is spread out clumped – for mating, protection, or food spot uniform – territory and food competition
Population density/distribution(14.3, pgs. 436-439) uniform clumped
Population density/distribution(14.3, pgs. 436-439) • Type I – big mammals (black bear) • few young (1-3), lots of care • Type II – small mammals, birds, rabbits • more young (4-12), less care • Type III – insects, parasites • thousands of young, no care
Population growth patterns (14.4, pgs. 440-444) Factors that affect populations: immigration – species moving in emigration – species moving out birth rate – goes up when habitat is good 4. death rate – goes down when habitat is good
Population growth patterns (14.4, pgs. 440-444) exponential growth – rapid population growth due to abundant resources (pennies) J-curve Australia: 24 were brought in 1859 for sport hunting, but enough food, and no good predators = 200-300 million today
Population growth patterns (14.4, pgs. 440-444) S - curve logistic growth – slow growth, then exponential growth, then level off due to resource limits
Population growth patterns (14.4, pgs. 440-444) • carrying capacity - average # supported by an ecosystem; environment quality can change capacity • population crash - dramatic decline • when above carrying capacity • weather related possibly • fire • new species that messes things up
Population growth patterns (14.4, pgs. 440-444) • limiting factors – factors that keep population down • density-dependent factors: are affected by the population of individuals; when above capacity • competition, predation, parasitism and disease, starvation • density-independent factors: not related to • population; can happen anytime • unusual weather, natural disasters, human activity