Download
1 / 1
20 likes | 60 Vues
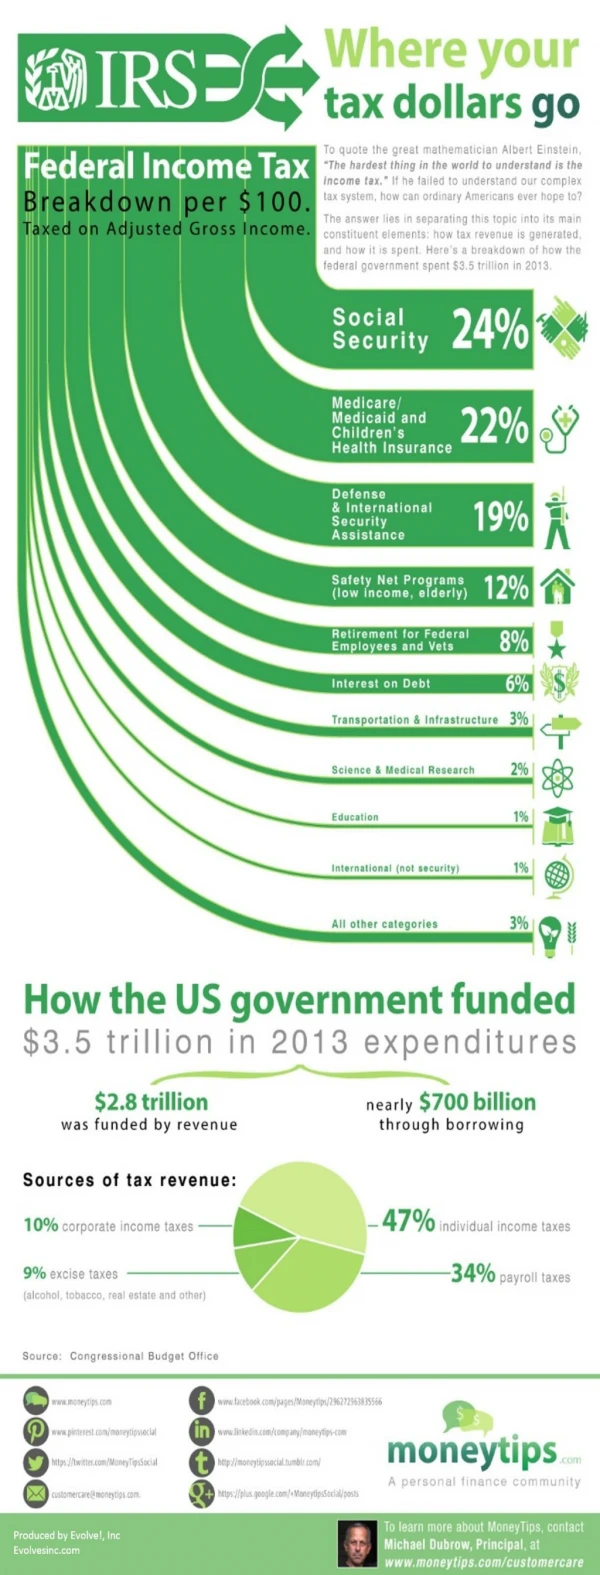
The IRS is like the mafia. You pay for protection but you end up feeling impoverished, confused, and with no understanding of how your taxes are going to be spent. Unlike the mafia, the IRS is all about fairness and legitimacy- unless you miss a payment. Then it's a discussion about jail time. But fortunately for us, the Congressional Budget Office keeps track of where our tax dollars are spent. So in the interest of transparency, let’s take a look at what actually happens to our tax dollars when they are given to the IRS. In 2013, the US government spent over $3.5 trillion, of which $700 billion was borrowed, which in total equates to 21% of our Gross Domestic Product (GDP). The top 5 major spend categories are: 1. Social Security (24%) 2. Medicare, Medicaid, Children’s Health Insurance (22%) 3. Defense and International Security (19%) 4. Safety Net Programs (12%) 5. Retirement for Federal Employees and Veterans (8%) As the infographic on this page reveals (I asked Moneytips.com a client of mine to prepare it for me), most of that spend is being funded by individual income taxes and payroll taxes (81%). Let’s take a closer look at how tax revenue is generated and spent.

E N D